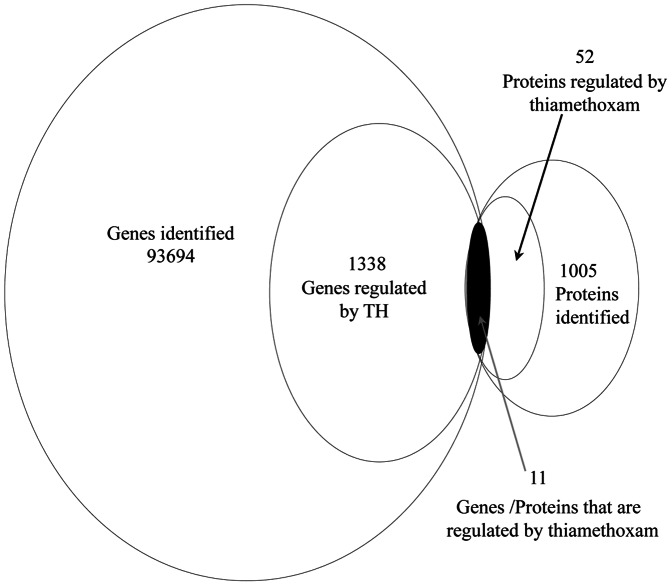
Figure 3. Correlation between the differently expressed proteins and genes.
Scatter plots illustrates the distribution of differentially expressed proteins and related genes. The Pearson correlation coefficient between proteins and mRNA expression profiles is shown in the upper left corner of the plot.

