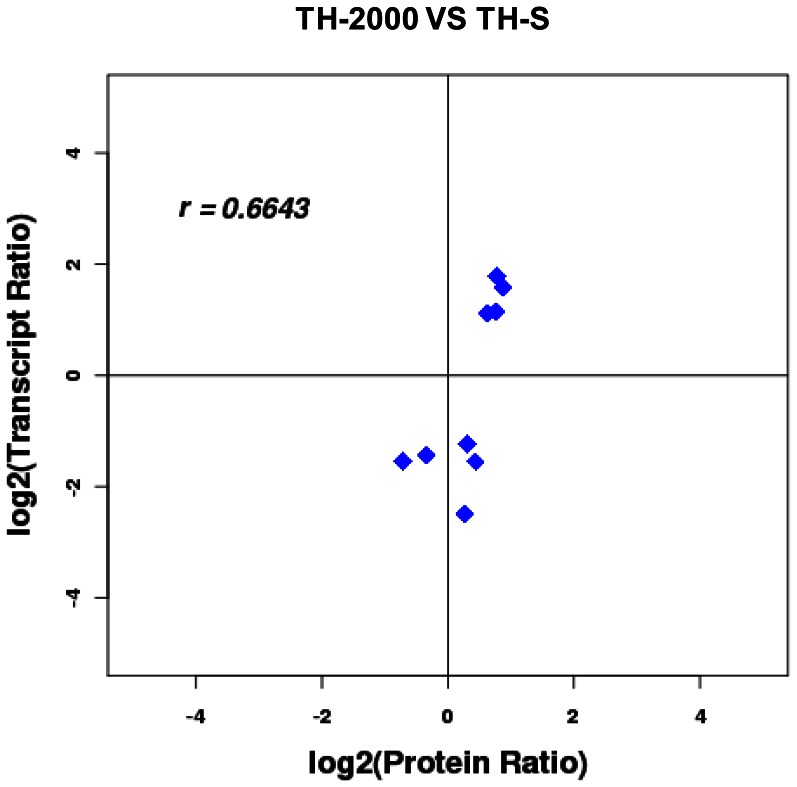
Figure 4. Quantitative real-time PCR analysis.
The relative gene expression of selected target genes was normalized to a BestKeeper composed of endogenous reference genes EF-1a and β-actin. Standard errors were generated from the three biological replicates. Asterisks denote significant gene expression differences between resistant and susceptible B. tabaci, as determined by a paired t-tests (* p<0.05, ** p<0.01).

