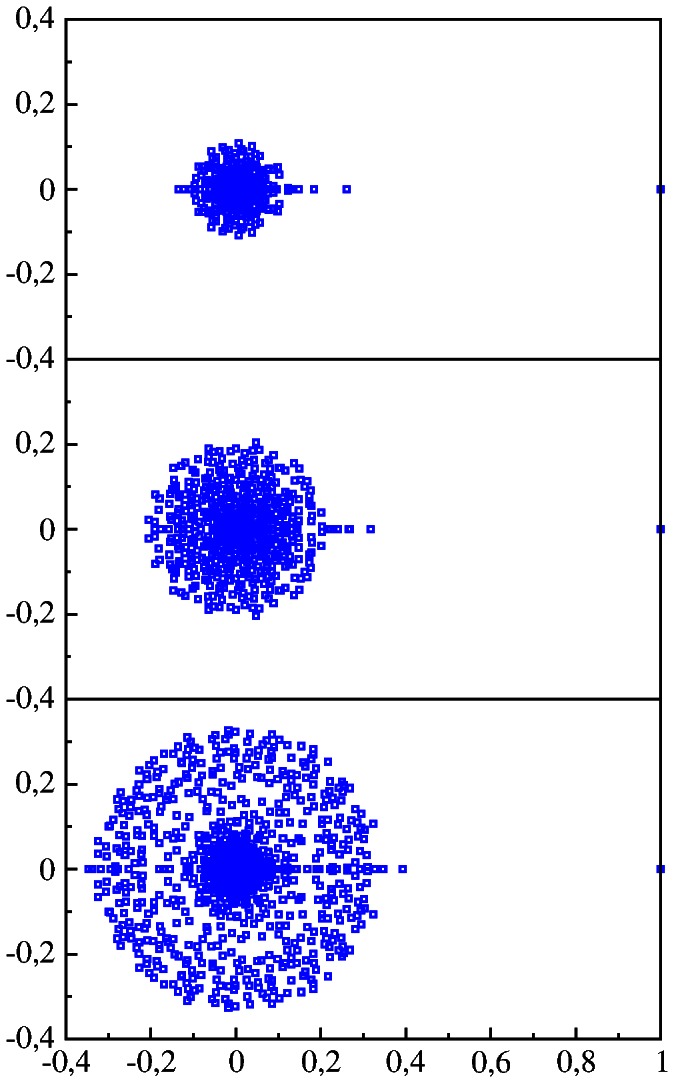
Figure 4. Spectrum of eigenvalues in the complex plane  for DNA Google matrix of Homo sapiens (HS) shown for words of
  letters (from top to bottom).

 for DNA Google matrix of Homo sapiens (HS) shown for words of
  letters (from top to bottom).