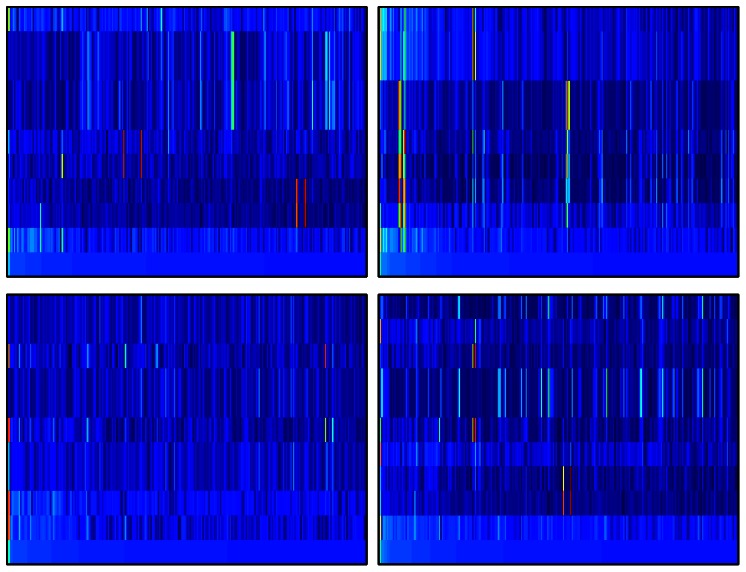
Figure 11. Dependence of eigenstates amplitude  on PageRank index
  in
in  -axis and eigenvalue index
  in
in  -axis for largest ten eigenvalues
  counted by
  from
from  at
at  to
to  at
at  .
.

The range  is shown with PageRank vector for a given species at the bottom line of each panel. For each species in each panel the color is proportional to
  changing from blue at zero to red at maximal amplitude value which is close to unity in each panel. The panels show the species: bull BT (top left), dog CF (top right), elephant LA (bottom left), Homo sapiens HS (bottom right).
