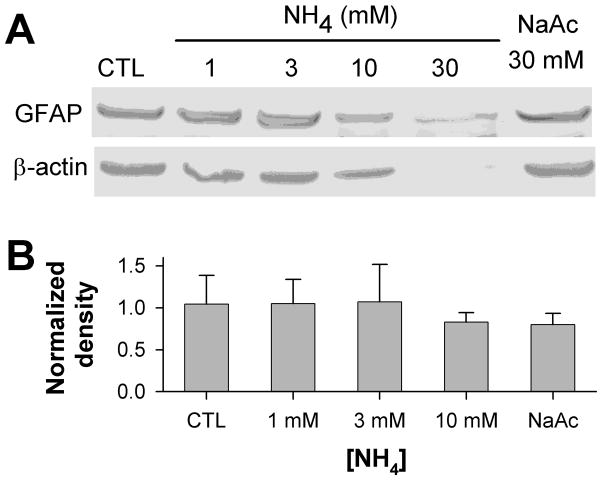
Figure 3. Immunoblotting for GFAP in ammonia-treated slices.
A) Representative immunoblot of protein lysates from slices treated for 3 days in control conditions, with NH4 acetate 1 – 30 mM, or with 30 mM Na acetate, probed for GFAP (upper panel) and re-probed for β-actin (lower panel). Immunoblotting detected single bands of ~ 50 kD for GFAP, and of ~ 42 kD for β-actin. B) Quantitation of GFAP band density, normalized to density of corresponding β-actin bands, detected no significant differences in GFAP content in samples from slices treated with 1–10 mM ammonia (n = 4; mean ± S.D.; p = 0.61). The 30 mM ammonia-treated samples, which showed large decreases in both GFAP and β-actin bands, were excluded from quantitation.

