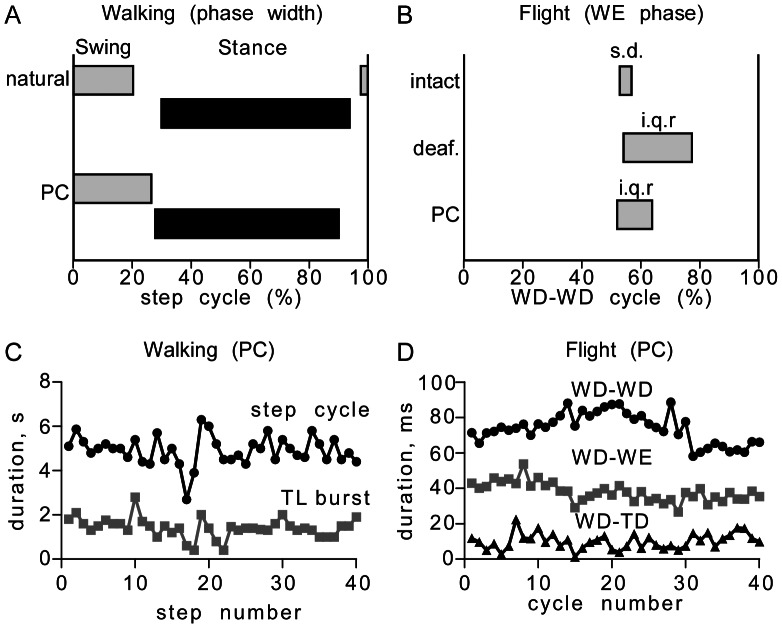
Figure 2. A general comparison of natural and pharmacologically induced walking and flight motor activity in intact and deafferented locusts.
A Walking. Bars giving the start and end of the swing (grey) and stance (black) phases within the step cycle. Top (natural): data for naturally occurring, free walking from [34] (means of the activity of two antagonistic coxal muscles). Bottom (PC): Pilocarpine (1 mM) induced fictive walking (this paper, medians of 19 animals, 15 cycles each). B Flight. Bars giving the range of the phase of wing elevator (WE) units in the depressor cycle (WD-WD). Top (natural): Standard deviation (s.d.) of phase for intact tethered flying locusts from [35]. Middle (deaf.): Interquartile range (i.q.r.) of phase for wind-induce fictive flight of deafferented locusts (this paper, 35 animals, 100 cycles each). Bottom (PC): Interquartile range (i.q.r.) of phase for pilocarpine (1 mM) induced fictive flight of deafferented locusts (this paper, 19 animals, 100 cycles each). C, D Sequential plots comparing pilocarpine (PC, 1 mM) induced fictive walking and fictive flight respectively. C Step cycle length (black circles) and duration of the TL burst (grey circles) for 40 step cycles over a 3 min period. D Wing depressor cycle length (WD-WD, black circles), wing depressor-elevator latency (WD-WE, grey squares) and wing depressor-trochanteral depressor latency (WD-TD, black triangles) for 40 fictive flight cycles over a 3 s interval. Note that the flight sequence analyzed here comprises an entire stance phase of simultaneously occurring fictive walking. Abbreviations as in Fig. 1.

