
Figure 5. Charts comparing key features of fictive walking patterns released by tyramine (TA, circles: 100 mM) and by a low and higher concentration of pilocarpine (PC, squares: 0.1 mM, triangles: 1 mM).
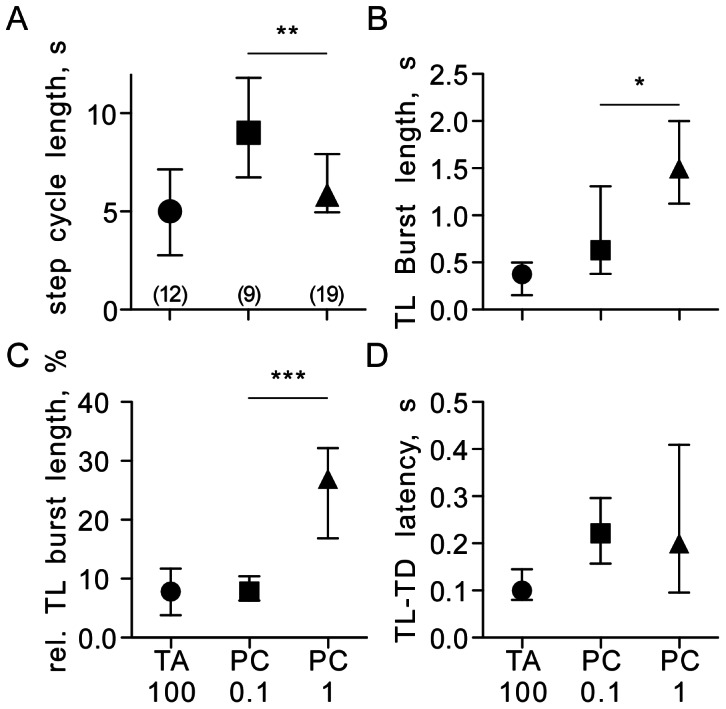
A Step cycle length, B TL burst length, C relative TL burst length (as % of step cycle length), D TL-TD latency. Symbols give the median, ticks the interquartile range and asterisks significant differences between indicated groups (Mann Whitney U test for unpaired data sets *p<0.05, **p<0.01, ***p<0.001). Numbers in parenthesis (chart A) give the number of preparations for each test group.