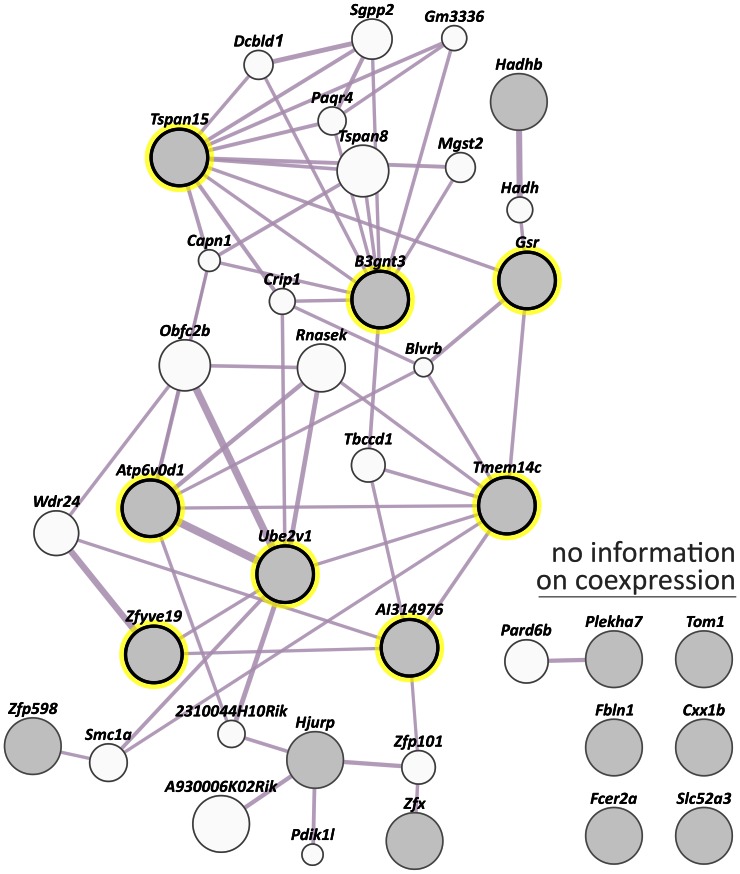
Figure 5. GeneMANIA co-expression analysis for the novel mRGs.
Direct co-expression of novel mRGs (filled grey circles) is highlighted by a yellow surrounding circle. For the genes on the top right there was no information on co-expression. Two genes are linked if their expression levels are similar across conditions in a gene expression study, mostly derived from peer-reviewed publication data publicly accessible via GEO. A thicker line indicates a higher combined weight. The circle size depicts the extent of relatedness of a particular gene to the query genes. The cluster of Gag genes was not queried. Note that D15Ertd30e (NCBI gene identity number: 52238) and Pcdha@ (192162) were not listed in the GeneMANIA system.

