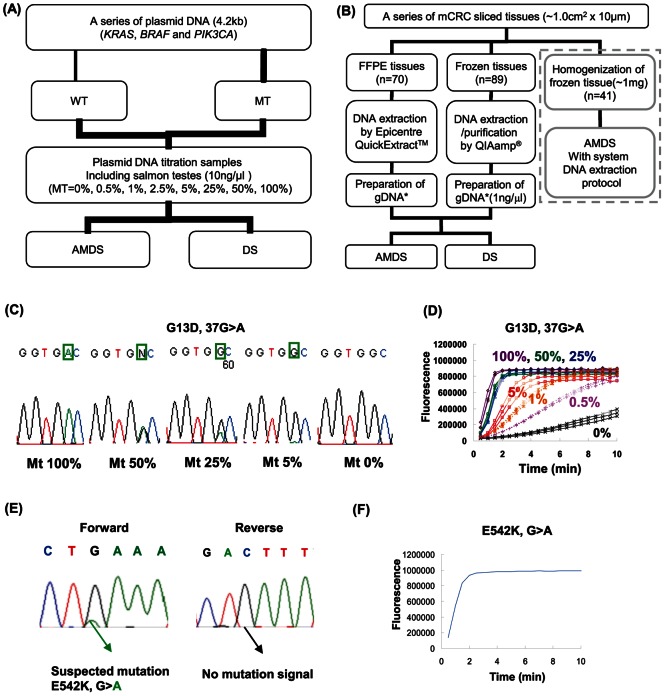
Figure 2. Evaluation of AMDS.
(A) Plasmid DNA titration study. Plasmid DNA was constructed for total 13 different mutants and 6 wild-type (KRAS: 1, BRAF: 1, PIK3CA: 2). (B) Clinical performance study. 70 FFPE sliced tissues and 89 Frozen sliced tissues were tested. Genomic DNA was extracted from FFPE sliced tissue by Epicentre® QuickExtract™. Genomic DNA was purified from frozen sliced tissue by QIAamp® DNA Micro kit. Also, as surrounded by dotted lines, about 1 mg of frozen sliced tissue was homogenized and used for fully automated mutation analysis. (C) Titration study of KRAS G13D mutation detection by DS. The electropherograms were taken for different mutant-wild mixture of plasmid DNA (10 fg/reaction). (D) Titration study for KRAS G13D mutation detection by AMDS. The graph shows the merged InvaderPlus® reaction data (n = 3) for different mutant-wild mixture for KRAS G13D detection by AMDS (◊; mt 100%, ○; mt 50%, △; mt 25%, Υ; mt 5%, *; mt 1%, +; 0.5% and ×; mt 0%). Amount of plasmid DNA was 10 fg/well. (E) Electropherogram of forward and reverse analysis of same sample (ID = 56754). (F) InvaderPlus® reaction of a sample (ID = 56754) by AMDS.

