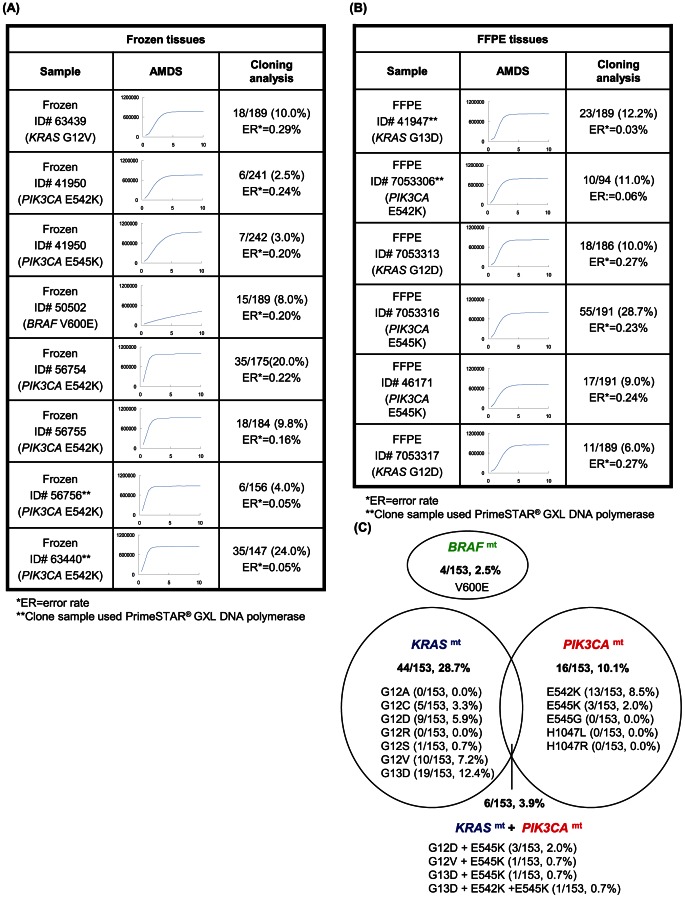
Figure 3. Cloning analysis and summary of genetic alteration in clinical samples.
(A) Cloning analysis result of Frozen tissues. (B) Cloning analysis result of FFPE tissues.; PCR was performed for frozen ID = 56756, ID = 63440 and FFPE ID = 41947, ID = 7053306 samples with PrimeSTAR® GXL DNA polymerase. Other samples were performed PCR with GoTaq® DNA polymerase. Potential mutation frequency in a sample = (number of mutant sequence)/(number of successful sequence). If the frequency was higher than ER, the sample was considered as mutation positive. Note: It was not confirmed whether mutation rate of a sample was able to be quantified by the cloning analysis. (C) Venn diagram of KRAS, BRAF and PIK3CA mutations. In this graph, these frequencies of mutation are not calculated for samples but for patients. 6 samples were taken from same tissues and prepared for both frozen and FFPE slice. The AMDS analyses for these 6 samples showed same results for both Frozen and FFPE slice.

