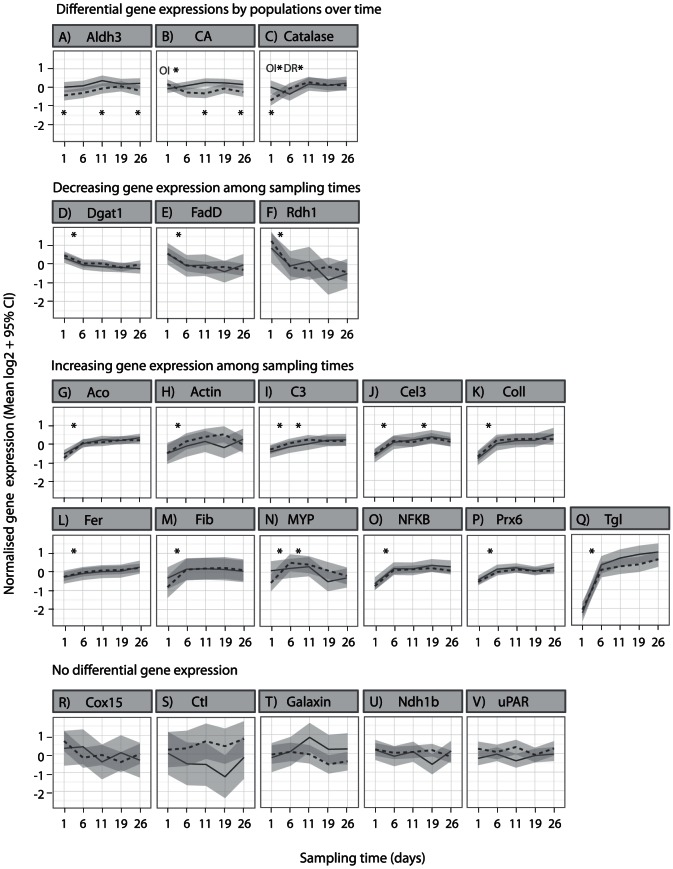
Figure 2. Temporal changes in gene expression of corals from two locations translocated to a common laboratory environment.
Lines represent means of normalized log2 transformed expression values among replicate colonies (solid line = Davies Reef, dashed line = Orpheus Island). The grey-shaded areas represent 95% confidence intervals of means. Plots are organised by the significance of model factors (FDR adj. P LRT<0.022). Model-derived significant differences over time-points are indicated with stars above means (and are population specific in A–C, FDR adj. P MCMC<0.024 or 0.018). Significant differences between populations at specific time-points are indicated by stars below means in A–C (FDR adj. P MCMC<0.022).

