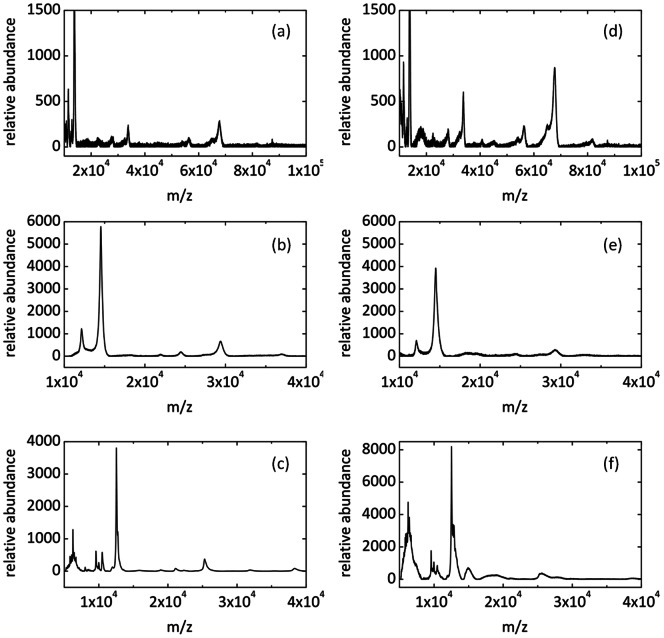
Figure 4. MALDI MS spectra of BSA, Cytochrome C and Lysozyme.
(a–c) Spectra obtained from samples spotted using the traditional dried drop technique. (d–f) Spectra obtained from samples spotted using the microfluidic interface and deposition probe. Proteins were prepared at stock concentrations and diluted 1∶1 in a Sinapinic acid matrix prepared at a concentration of 12.5 mg/ml in 45% acetonitrile, 45% ethanol and 10% (0.1%) trifluoroacetic acid.

