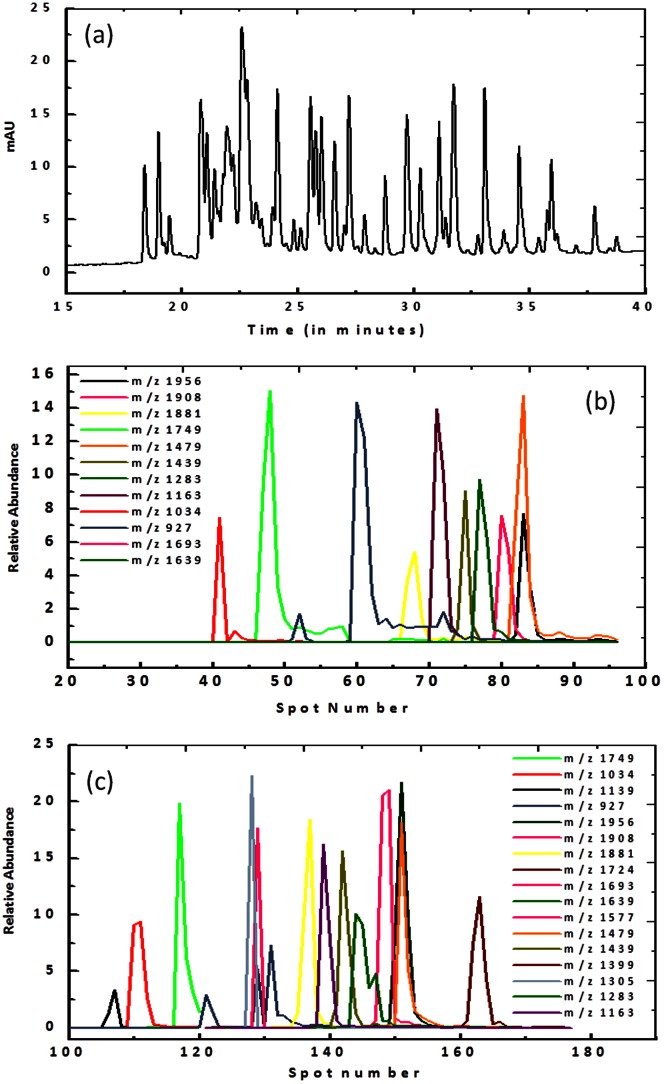
Figure 6. LC–MALDI MS analysis of peptides generated from Trypsin digested Bovine Serum Albumin.
(a) The LC separation profile of the BSA digest. (b) and (c) detail the mass spectrometry results using a commercial spotter and using the deposition probe respectively. The mass spectrometry results were plotted as relative peptide abundance versus the spot number. Table S4 compares the results from each spotter and lists the mono-isotopic mass of each peak.

