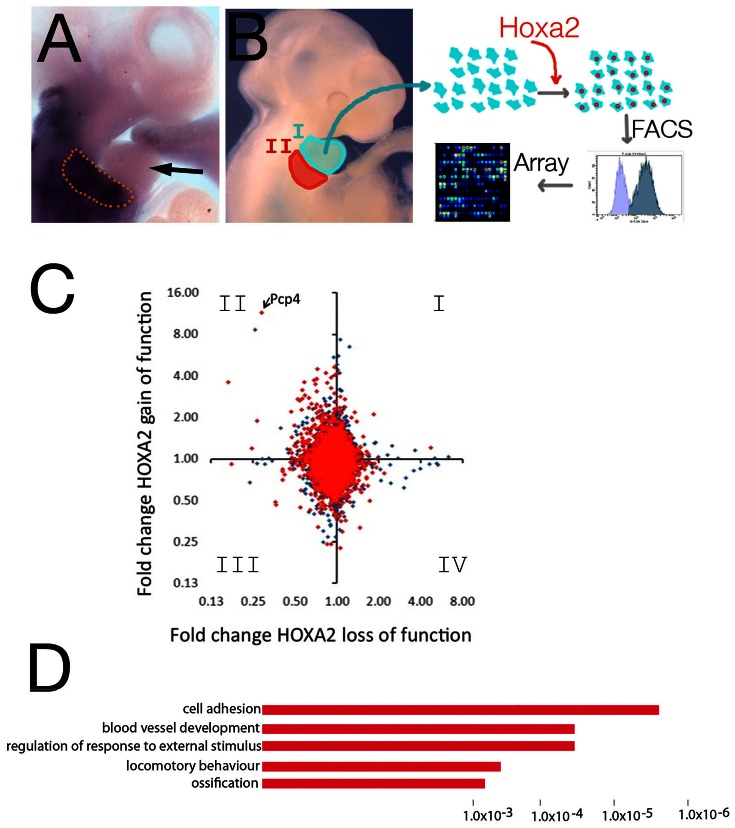
Figure 1. Hoxa2 gain of function in IBA cells.
A, In situ hybridization using Hoxa2 probe shows Hoxa2 is mainly expressed in the IIBA (enclosed in the dotted line) and expression is excluded from the IBA (arrow). B, Schematic representation of the experiment: cells isolated from IBA are grown in vitro and transfected with Hoxa2-IRES-GFP (or GFP alone, control). RNA is extracted from GFP-positive cells and analyzed by microarray. C, Pairwise comparison of microarray experiments for Hoxa2 loss of function (x-axis) versus Hoxa2 gain of function (y-axis). Data are plotted as fold change against control in each case (axes in logarithmic scale base 2). Genes in red are nearby a Hoxa2-bound region in ChIP-seq (closest two genes to Hoxa2-bound region were included). D, Functional annotation of genes responsive to Hoxa2 gain of function only. The top over-represented categories are shown; the length of the bars corresponds to the P-values on the x-axis.

