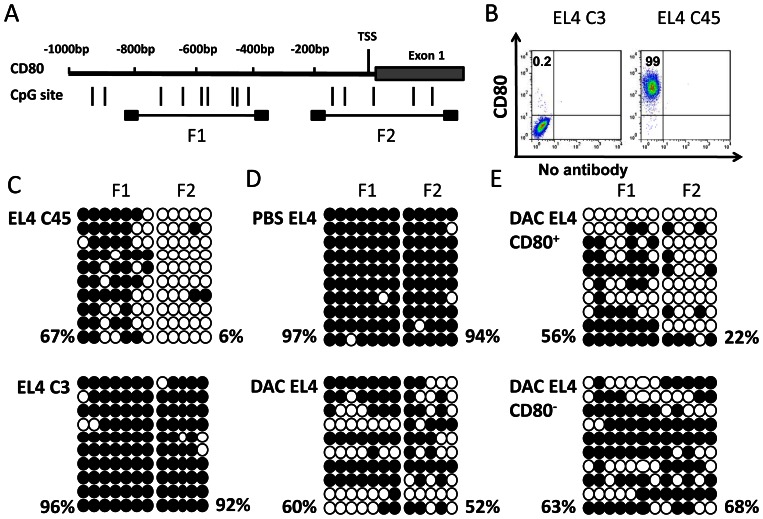
Figure 6. DNA methylation of CD80 promoter region in EL4 and its variant cells.
(A) The distribution of CpG dinucleotides in a region 1 kb upstream of Exon 1 of CD80 gene. Numbers refer to position relative to the 5′ end of CD80. Two CpG enriched regions (F1 and F2) were selected for Bisulfite sequencing analysis. (B) Flow cytometric analysis of CD80 expression on two EL4 variants (EL4C3 and EL4C45). Numbers in flow cytometric figures indicate % positive cells corresponding to each gate. (C) Bisulfite sequencing of the CD80 promoter region in EL4C45 (upper panel) and EL4C3 (lower panel). Open and filled circles represent demethylated and methylated CpG sites, respectively. The methylation frequency at CpG sites of each cell line is indicated. (D) Bisulfite sequencing analysis of CD80 promoter region in DAC- and PBS-treated EL4 cells. (E) EL4 cells were first treated with DAC or PBS, CD80+ and CD80− EL4 cells were then sorted by flow cytometry-based sorting. Bisulfite sequencing analysis was performed on DAC-treated, CD80+ and CD80− EL4 cells.

