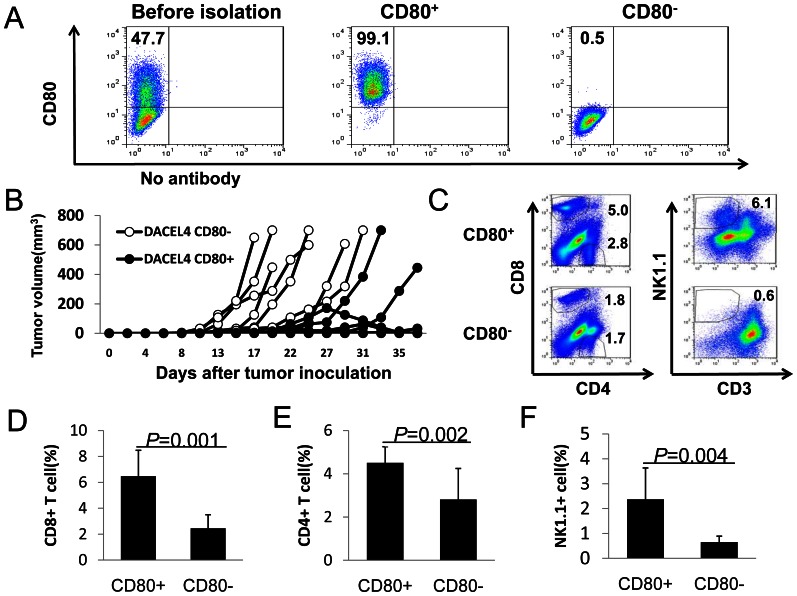
Figure 7. DAC educated CD80 positive, but not CD80 negative EL4 cells induce T cell responses.
(A) EL4 cells were treated with DAC. CD80+ and CD80− EL4 cells were separated by flow cytometry-based sorting. Flow cytometric analysis of CD80 expression in EL4 cells before and after sorting is shown. (B) Tumor growth kinetics of DAC-treated CD80+ and CD80− EL4 cells. 2×10⁴ CD80+ or CD80− DAC-treated EL4 cells were injected s.c. into each mouse. Tumor growth in individual mouse is shown. (C) Flow cytometry analysis of T cell and NK cell infiltration in CD80+ and CD80− tumors. Single cell suspensions of tumors were stained for CD4, CD8, CD3, NK1.1 followed by flow cytometry analysis. Percentage of CD8+ (D), CD4+ (E) and NK1.1+CD3− (F) in CD80+ tumors (n = 6) and CD80− tumors (n = 6) were quantified. Data shown are mean+SEM and are representative of four independent experiments with similar results. Numbers in flow cytometric figures indicate % positive cells corresponding to each gate.

