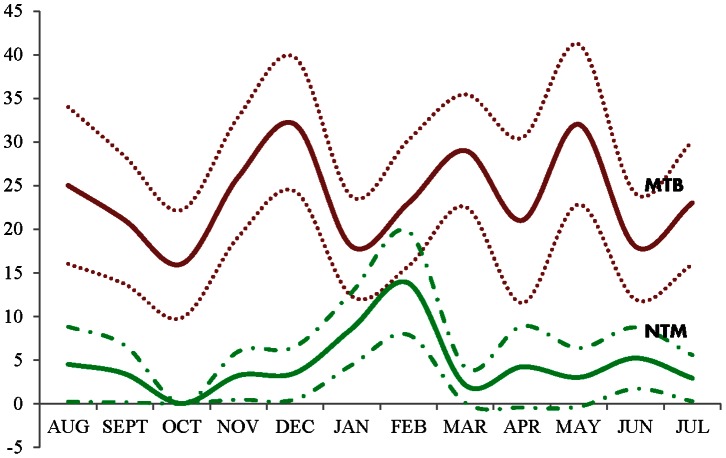
Figure 2. Pattern of occurrence of tuberculosis and non-tuberculous mycobacterial infections over 12 calendar months in Nigeria.
Y-axis: monthly proportions of NTM and MTB complex among all subjects screened (solid lines indicate proportion while dotted lines are the 95% confidence interval of the proportion) X-axis: time in months.

