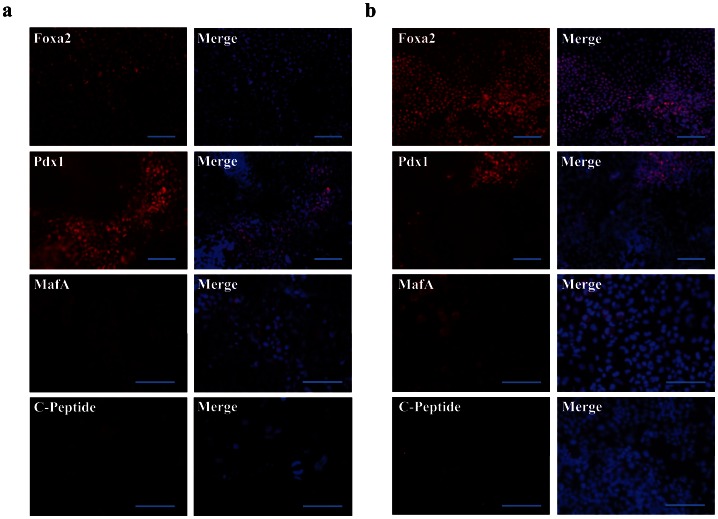
Figure 2. Immunostaining of rMAPC and rHypoSC progeny.
Fluorescence micrographs showing expression of FoxA2, Pdx1, MafA and C-peptide in d21 rMAPC-1 (A) and Fi2 (B) differentiated progeny. Scale bars, 100 µm. Representative for n = 3 independent differentiations. Merge indicate FoxA2, Pdx1, MafA and C-peptide together with DAPI staining.

