
Figure 1. Nucleosome positioning is progressive during early embryonic development.
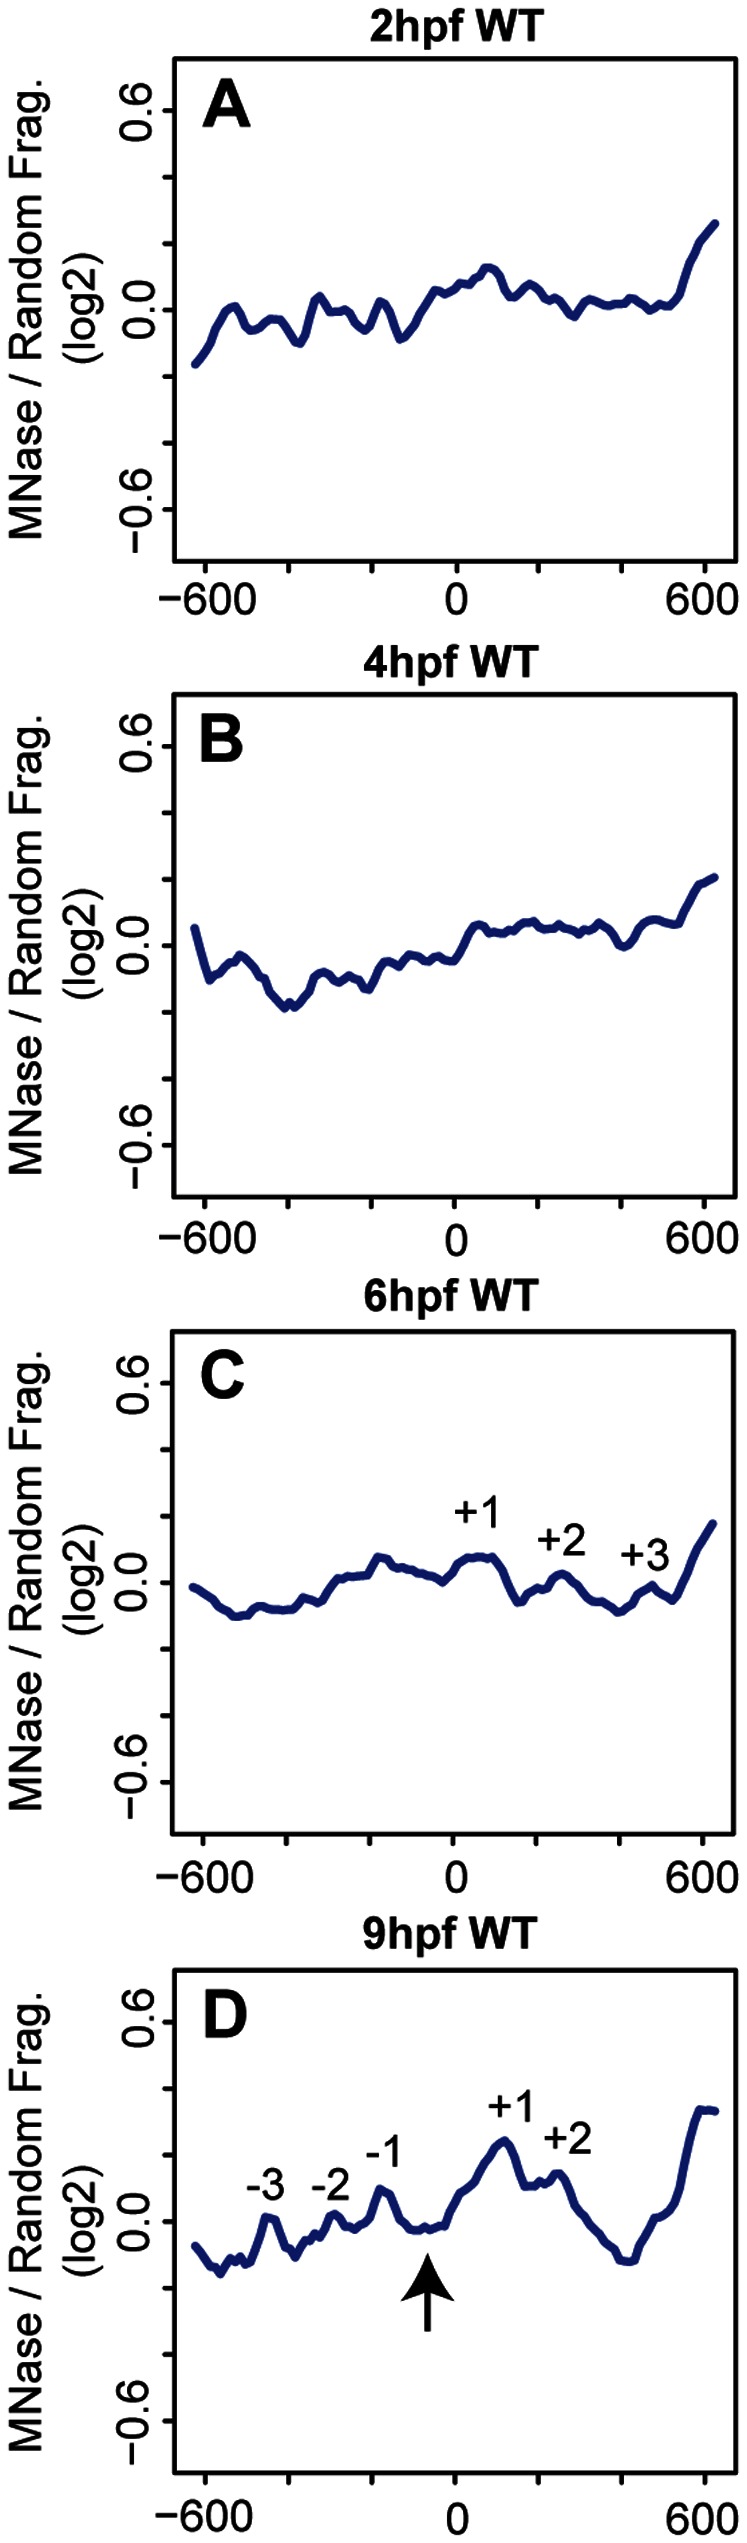
(A–D) Average nucleosome density for 37 zebrafish hox promoters was calculated as the log2 ratio of MNase digested to randomly fragmented genomic DNA for positions −600 to +600 relative to the TSS (TSS is set as 0 on X-axis) at 2 hpf (A), 4 hpf (B), 6hpf (C) and 9hpf (D). Detectable nucleosome peaks are numbered in panels C (at positions +60, +260 and +480, separated by 200 bp and 220 bp respectively) and D (at positions −450, −290, −170, +155, and +250 bp, separated by 150 bp, 120 bp, 290 bp, and 130 bp respectively). Arrow in panel D indicates a nucleosome depleted region (NDR) formed between the −1 and +1 nucleosomes.