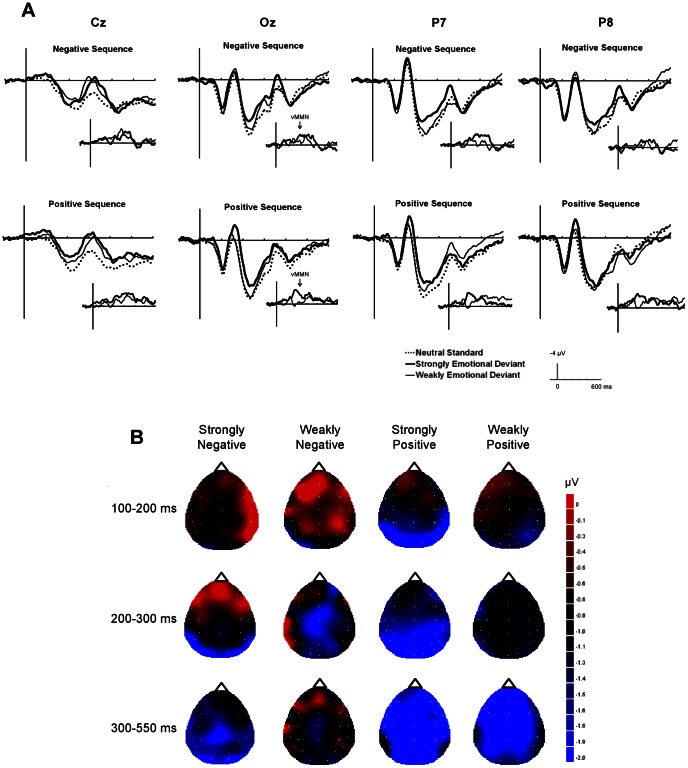
Figure 2. ERP results in Experiment 1.
(A) The grand-average ERPs at Cz, Oz, P7, and P8 elicited by standards (dashed line), strongly emotional deviants (bold line), and weakly emotional deviants (thin line) in negative and positive sequences. The inset shows vMMN, grand average deviant-minus-standard, for strongly emotional deviants (bold line) and weakly emotional deviants (thin line). (B) The topographies of the voltage difference between the standards and the deviants at the peak latencies for each time period. The images have been flattened into a two-dimensional space using the global interpolation method, which uses all electrodes to calculate values at any given point, viewed from the top of the head.

