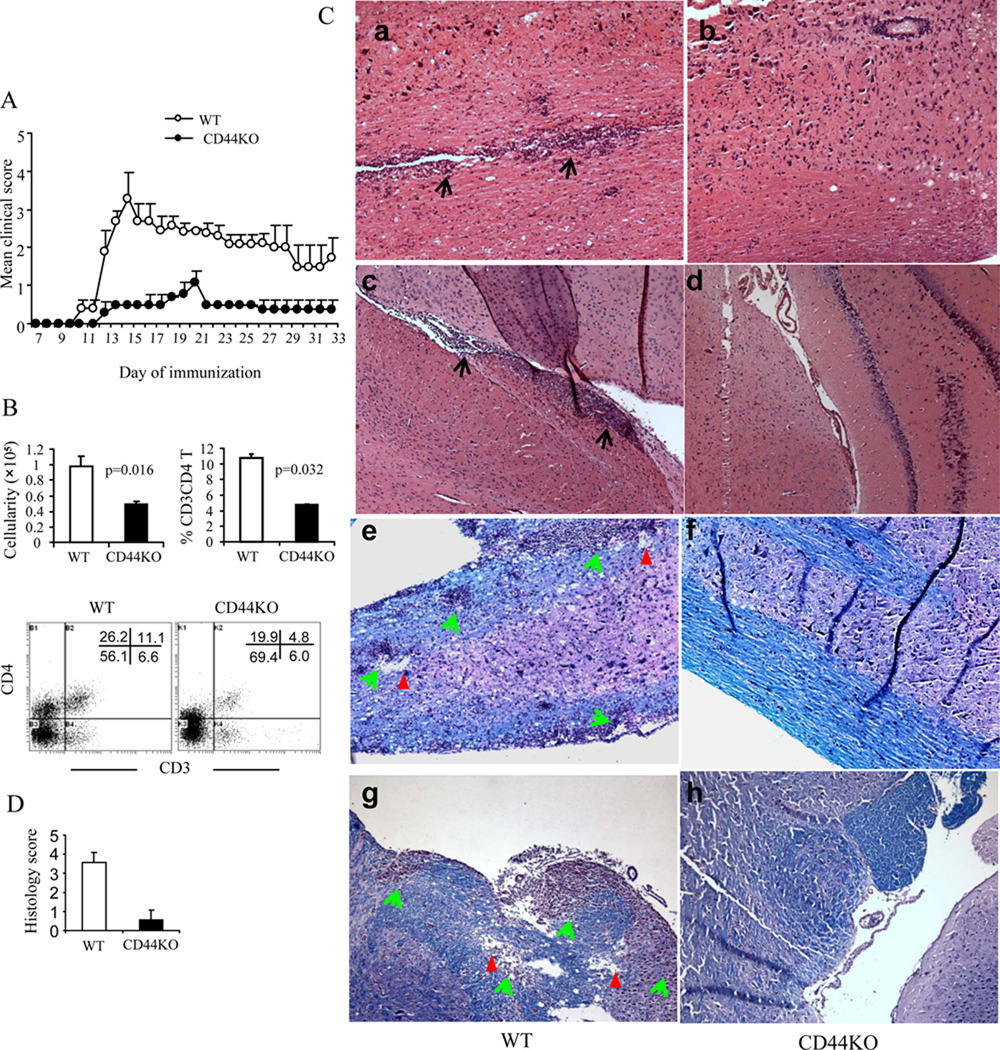
Figure 1. Amelioration of EAE by deletion of CD44.
A. EAE was induced by immunization of MOG35–55 peptide. Clinical signs of EAE were monitored daily and scored. Data are expressed as mean ± SEM. B. Cells infiltrating the CNS were enumerated as well as stained to identify CD3+CD4+, CD3+CD8+ T cells by flow cytometry. A representative dot-plot for double–staining for CD3 and CD4 is depicted. The vertical bars represent mean ± SEM from three different experiments. C. Spinal cord (a, b, e. f) and brain (c,d, g, h) sections were prepared on d 20 post-MOG immunization and analyzed for inflammation by H&E (a–d) and for degree of demyelination (e–h) by Luxol fast blue (LFB). Demyelination is indicated by loss of blue staining and vacuolation associated with mononuclear cell infiltration. Black and green arrows indicate mononuclear cell infiltrates; red arrowheads indicate demyelination and vacuolation. D. Mean ± SEM histological scores for brain sections. Original magnification, ×100.

