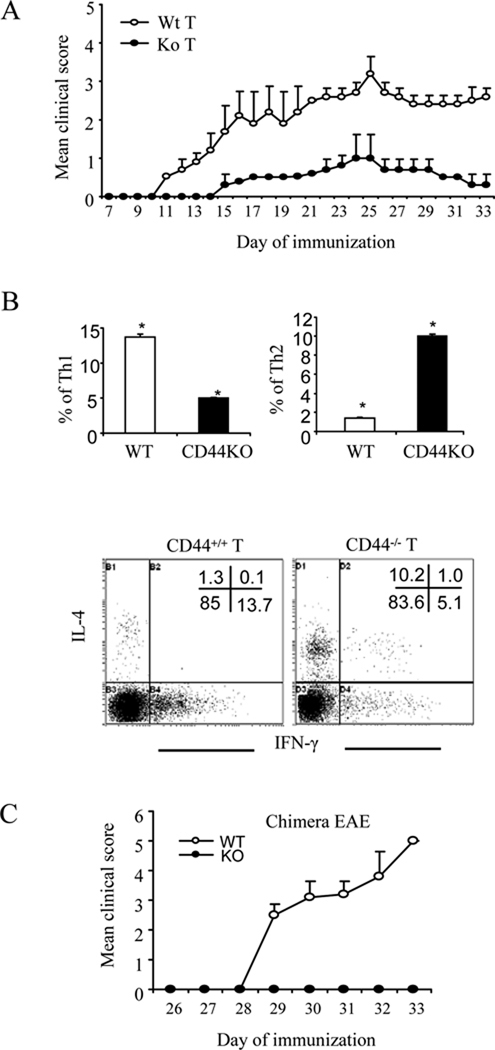
Figure 4. CD44 expression on encephalitogenic T cells regulates EAE pathogenesis.
A. Splenocytes obtained from WT and CD44 KO mice on d 8 post-immunization were stimulated with MOG35–55 peptide for 3 days. Next, the cells were harvested and adoptively transferred into lightly irradiated (300 rads) C57BL/6 recipients (10 ×106 cells per mouse). Clinical signs of EAE were monitored daily and expressed as mean clinical scores ± SEM. B. CNS-infiltrating MNCs isolated from the recipients at d 30 of adoptive transfer were stimulated with MOG35–55 peptide for 24 h followed by intracellular staining for IFN-γ and IL-4. Representative dot-plots and average percentage of Th1 and Th2 are shown. Data were expressed as mean ± SEM from three independent experiments. Gates were set for CD4+ subset. *: p<0.001 comparison between WT and CD44 KO group. C. CD44−/−CD4+ T cell chimeras were created as described in the Methods. EAE was induced and clinical scores were expressed as mean ± SEM. WT represents chimeras in which the CD4+ T cells and all other cells were CD44+/+; KO represents chimeras in which only CD4+ T cells were CD44−/− while remaining cells were CD44+/+.

