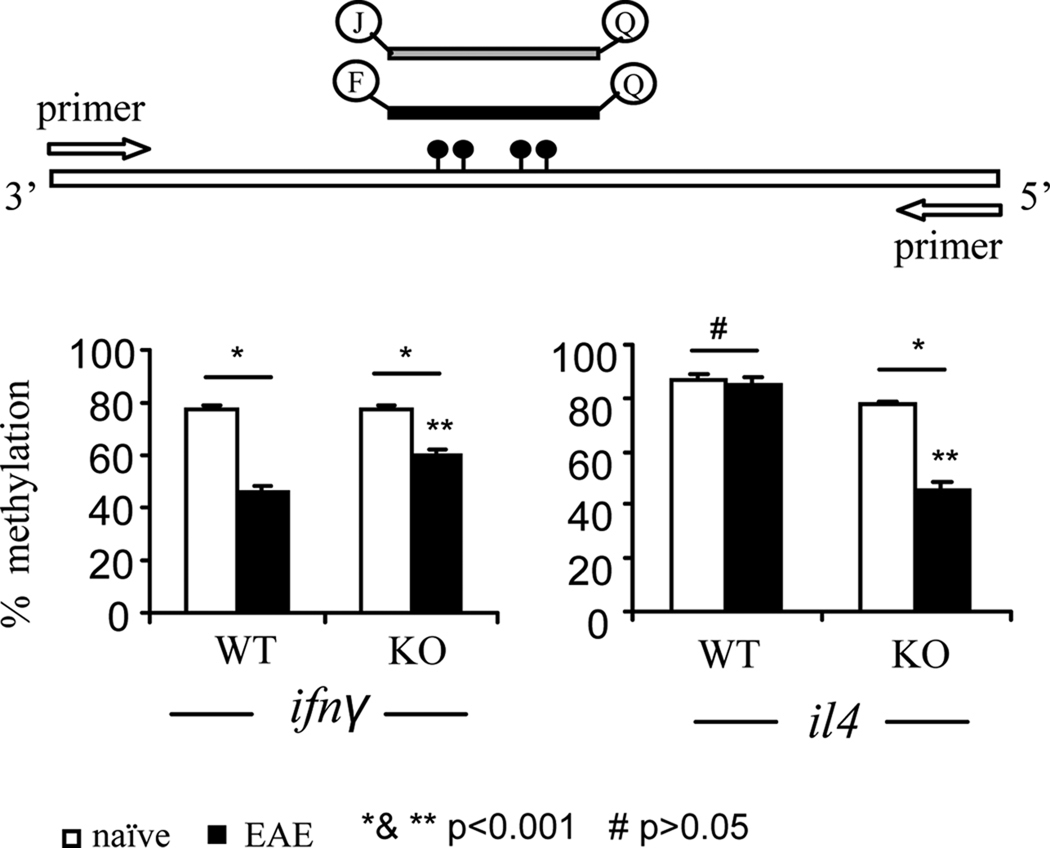
Figure 6. DNA methylation analysis.
Splenocytes at d 14 post immunization were restimulated with MOG35–55 peptide for 24 h. CD4+ T cells were further purified from the culture. Genomic DNA was isolated from the CD4+ T cells and subjected to bisulfite conversion. DNA methylation at ifnγ and il4 loci was analyzed by Methylight quantitative real-time PCR. The schematic depiction of the protocol for the PCR and average percentage of DNA methylation has been shown. Data were expressed as mean ± SEM from three independent experiments. *: p<0.001 comparison between naïve and EAE group; **: p<0.001 between WT EAE and CD44 KO EAE group; #: p>0.05 comparison between naïve WT and EAE WT group for il4.

