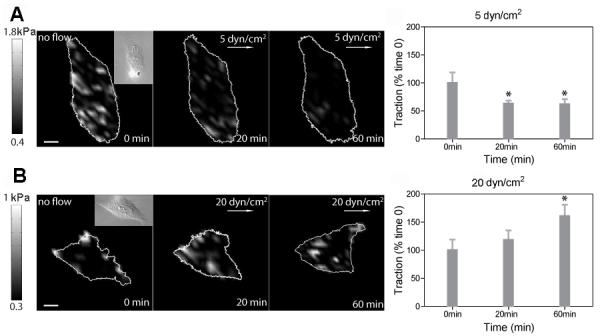
Fig. 4.

Dynamic tractions are regulated in a stress-magnitude dependent way. Dynamic traction maps and time courses of averaged tractions in response to 5 dyn/cm2 (A; n = 5 cells) and 20 dyn/cm2 (B; n = 5 cells). The color bars represent tractions. The white arrows indicate the shear stress direction. Insets are corresponding DIC images. Values are normalized by the tractions at 0 min. For statistical analysis, tractions at 20 min and 60 min were compared with tractions at 0 min (* P < 0.05). Scale bars, 10 μm.
