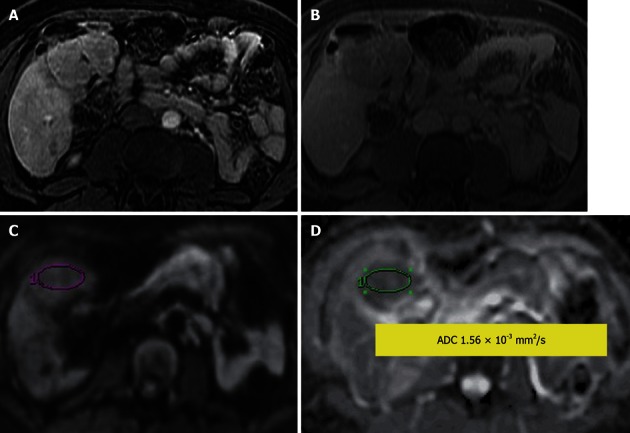
Figure 3.

Hepatocellular adenoma. A: Contrast-enhanced T1-weighted gradient recalled-echo in arterial phase; B: Delayed post contrast phase; C: Diffusion-weighted image; D: Apparent diffusion coefficient (ADC) map. An arterial enhancing lesion with delayed wash out is visible; it demonstrates impeded diffusion with ADC = 1.56 × 10⁻³ mm2/s.
