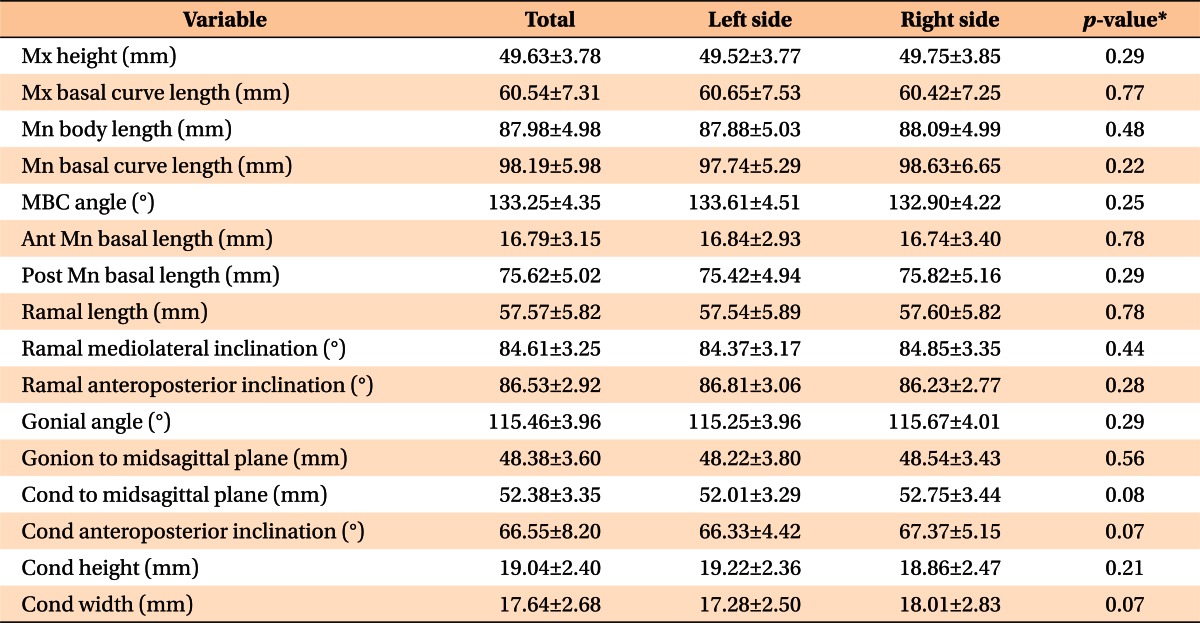
Table 3.
Comparison of three-dimensional maxillary and mandibular measurements between right and left sides (n = 38)

Values are presented as mean ± standard deviation.
Mx, Maxillary; Mn, mandibular; MBC, mandibular body curve; Ant, anterior; Post, posterior; Cond, condyle.
*Paired t-test.
