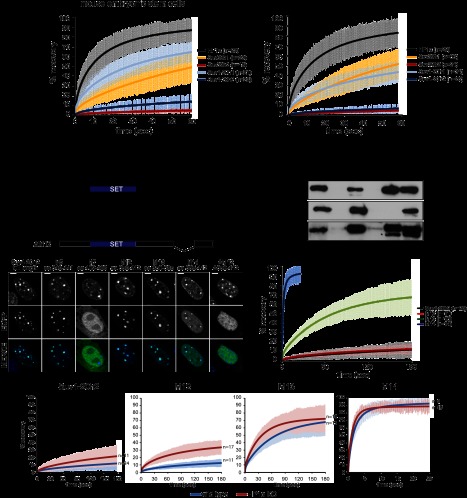
Figure 1.
Suv4-20h2 is a stable component of pericentric heterochromatin. (A) FRAP analysis of core heterochromatin proteins. EGFP-tagged proteins were expressed in wild-type ES cells and MEFs. Laser bleaching and analysis of fluorescence recovery were carried out specifically at pericentric heterochromatin. FRAP recovery experiments for multiple cells (indicated in the legend) were averaged and fitted to a reaction diffusion model. Error bars represent the standard deviation of the FRAP measurements in each series. (B) Distinct regions in the C terminus mediate heterochromatin localization of Suv4-20h2. (Top panel) Schematic showing Suv4-20h2 truncation proteins that were expressed as EGFP fusion proteins in wild-type MEFs. (Bottom panel) Confocal sections of MEFs expressing EGFP-tagged Suv4-20h2 truncations. Bars, 5μm. (C) In vitro interaction test of Suv4-20h2 truncation proteins and HP1 isoforms. GST-tagged Suv4-20h2 truncation proteins were bound to GST beads and incubated with recombinant HP1α, HP1β, and HP1γ, respectively. Bound proteins were separated on SDS page and probed with HP1 isoform-specific antibodies. The asterisk indicates cross-reacting bands with the HP1γ antibody. (D) FRAP kinetics of Suv4-20h2 truncation proteins at pericentric heterochromatin. The C-terminal fragment M12 is as stable as the full-length Suv4-20h2 protein. Subfragments of M12 (M13 and M14) show a much faster recovery. FRAP recovery experiments for multiple cells (indicated in the legend) were averaged and fitted to a reaction diffusion model. Error bars represent the standard deviation of the FRAP measurements in each series. (E) Suv4-20h2 is more dynamic in HP1α mutant cells. Suv4-20h2 full-length and truncation proteins were expressed in wild-type and HP1α knockout cells. FRAP kinetics at heterochromatin of all Suv4-20h2 truncations are faster in HP1α mutant cells. FRAP recovery experiments for multiple cells (indicated in the legend) were averaged and fitted to a reaction diffusion model. Error bars represent the standard deviation of the FRAP measurements in each series.

