Figure 3.
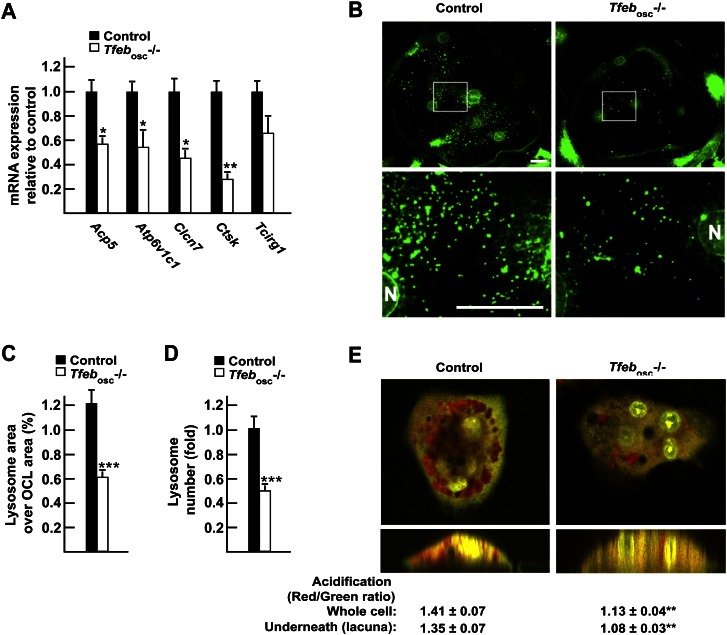
TFEB regulates lysosomal biogenesis in osteoclasts. (A) qPCR expression analysis in control and Tfebosc−/− flushed long bones. (B) LAMP1 immunofluorescence staining of control (left panels) and Tfebosc−/− (right panels) primary osteoclasts. The top panels show 40× magnification pictures, and the boxed area is further magnified in the bottom panels. Bar, 10 μm. (N) Nucleus. (C) Quantification of the percentage of the osteoclast area covered by lysosomes in individual osteoclasts. (D) Quantification of the number of lysosomes per osteoclast relative to control, normalized by the osteoclast area and the number of nuclei per osteoclast. (E) Acridine orange staining of live osteoclasts differentiated on bone slices imaged in a Z-stack using a confocal microscope. The ratio of red (acidic) over green (neutral) signal was quantified in several osteoclasts (n = 10–12) within and underneath the cells. The bottom panels display an orthogonal projection of the top panels. All experiments were performed at least in quadruplicate, and four to six animals of each genotype were analyzed in A.

