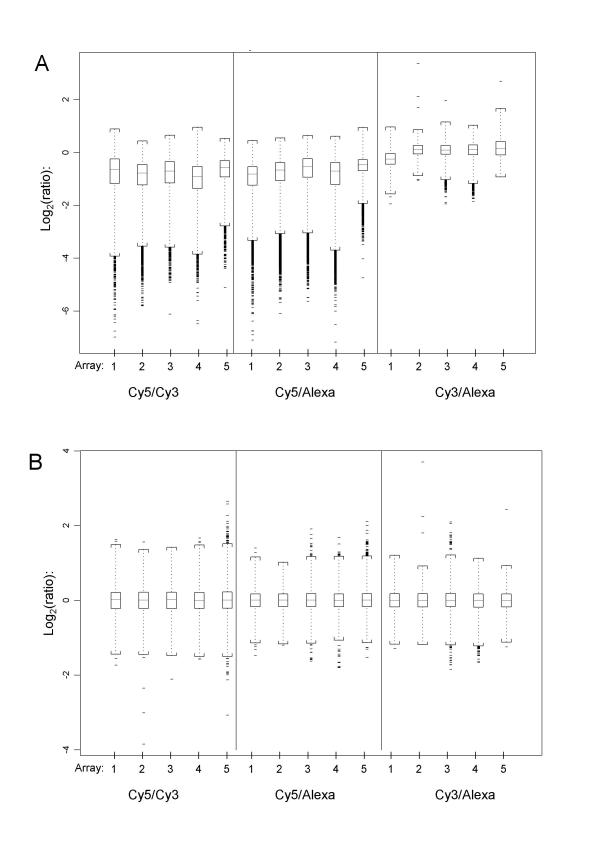
Figure 2.
Triple-target: Log-ratio data (A) Each panel shows the data distribution for 5 log-ratios of a particular dye-label combination within an array before normalisation. Triple-self hybridisation log-ratios for all genes and dye-label combinations should theoretically be centred on 0. Log-ratios involving the Cy5 labelled sample clearly show a larger log-ratio error and global shift away from 0 than the pairing of Cy3/Alexa594. This is consistent for all 5 replicate arrays. (B) Log-ratio distributions after removal of systematic global effects (dye-label incorporation, hybridisation quality, scan settings) by means of LoWeSS normalisation followed by a median absolute deviation adjustment of scale. Interpreted globally (across all genes on an array), log-ratio distributions are now directly comparable across all arrays and dye-label combinations.

