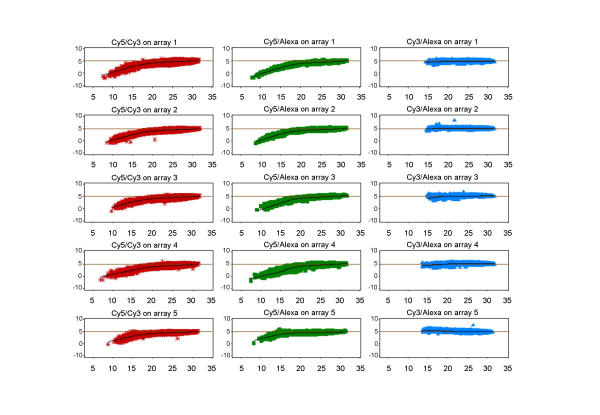
Figure 4.
Triple-target: MA plots before normalisation MA plots are a commonly used visualisation tool to show global trends in dual-target hybridisation data. Instead of only one possible combination per array, we have included the other two dye-label pairs. The X axis represents the intensity level, the Y axis the corresponding expression ratio for a gene between the two selected channels. A clustering of data points around the horizontal line is the theoretical result of any self-to-self hybridisation. A local scatterplot smoother function (LoWeSS) is fitted to the data to show global trends and to provide an intensity-dependent correction function to remove any bends in the global trend and adjust it so that the global trend approximates the theoretical ideal. A bend in the global trend indicates that the log2-ratio differs with intensity level. This graph clearly shows that log2-ratios involving Cy5 have non-linear intensity-dependent trends which require normalisation, whereas the combination Cy3/Alexa594 is already closer to ideal prior to normalisation.

