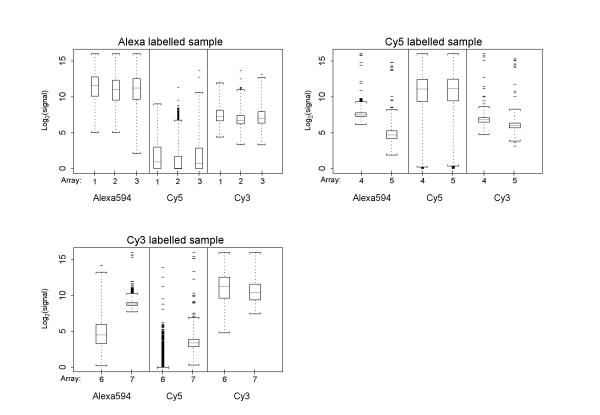
Figure 9.
Single-target: data before normalisation For all single-target hybridisations, these boxplots show the signal distributions across all genes for each individual dye-label sample, before normalisation. Only one sample per array has been hybridised, but the other two scans on the "blank" channels were still performed at their respective wave-lengths. Similar to the dual-target hybridisations, the data suggest that dye-labelling with Alexa594 will result in a small but noticeable signal in the Cy3 signal wavelength, Cy3 will result in a similarly small signal in the Alexa594 wavelength. However, dye-labelling with Cy5 also leads to quantifiable levels of signal in the other two channels. This is not visible in the array images themselves, but quantification of false-colour images by eye will inherently be different from algorithm-based quantification.

