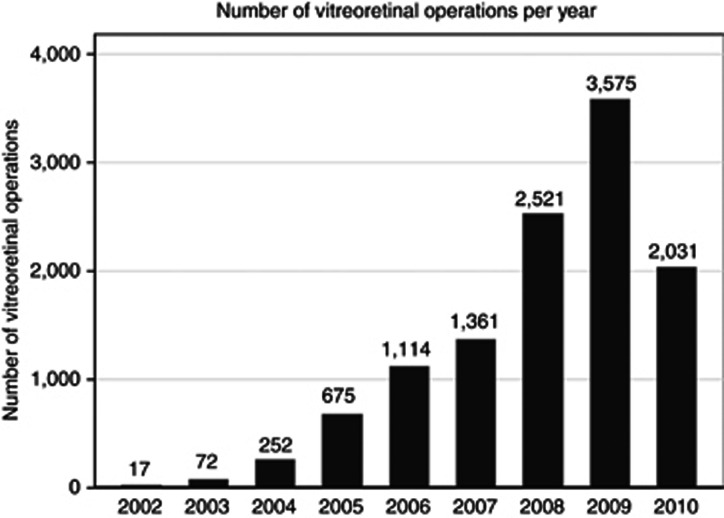
Figure 1.
The figure shows the number of vitreoretinal operations recorded on the NOD. The increasing number of operations per year reflects an increasing number of sites contributing to the NOD. The years shown are as defined by the NHS, running from 1st April to 31 March. In 2010, data were collected from the 1st of April to the 30th of November. The total number of operations is 11 618 over 8.7 years.

