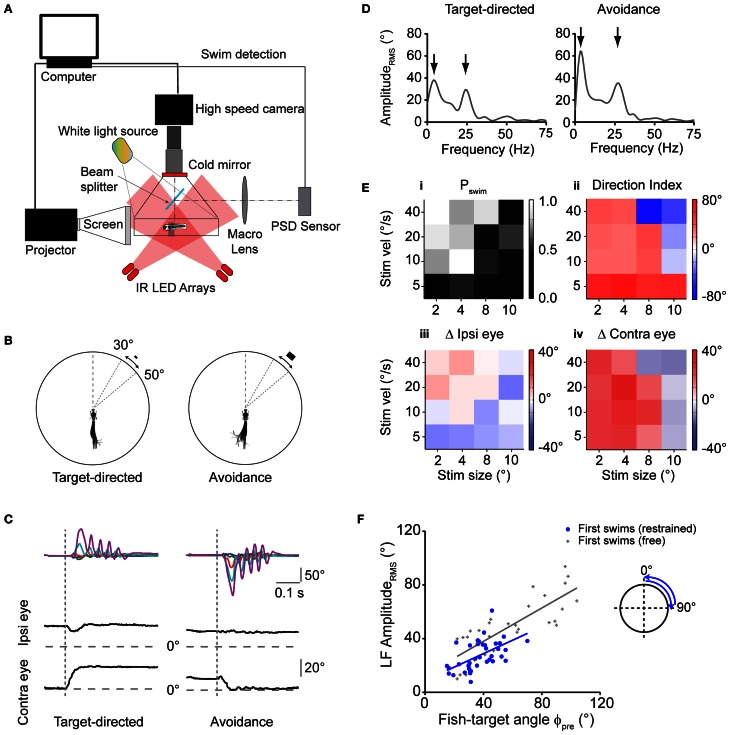
Figure 4.
Virtual prey-like stimuli evoke swims similar to motor patterns during prey capture. (A) Illustration depicting the setup used to record swim bouts in response to visual stimuli presented to minimally restrained larvae. A position-sensitive device (PSD, right) is used to detect swims and update the visual stimulus at high speed. (B) Left: swim bout toward a rectangular stimulus (width × height: 2 × 1°), moving at 20°/s peripherally between 30 and 50°. Right: swim bout toward the opposite direction of a rectangular stimulus (8 × 4°) moving at 40°/s. Every 10th frame of the high speed movies during the swim bout is overlaid. Angular dimensions drawn to scale. Fish and chamber dimensions not drawn to scale. (C) Time course of tail angles and ipsilateral and contralateral eye angles for the examples shown in (B) obtained using automated image analysis. Same color code as in Figure 3A. Note: high spatial resolution during imaging of restrained larvae allowed automated eye angle analysis. (D) Summed RMS amplitude spectra obtained from traces in (C) for the target-directed (left) and avoidance swim bout (right). Note two peaks in the spectra (arrows), similar to spectra measured in freely moving larvae during prey capture. (E) Summary of motor output in response to 16 different combinations of size and velocity of a moving stimulus. Panel (i): probability of observing a swim bout during a 60 s interval of stimulus presentation. Panel (ii): direction index calculated from LF peaks in the amplitude spectrum, showing target-directed, and avoidance turns (red and blue squares, respectively). Panel (iii): change in position of ipsilateral eye. Positive values indicate rotation to more nasal position. Panel (iv): same as panel (iii), but for contralateral eye. Positive values indicate rotation to more nasal position. In panels (ii–iv), colors indicate mean values (n = 6–12 trials for each stimulus parameter pair). Note: for each panel, the value of the target size denotes the width of the stimulus and width:height ratio is always 2:1. (F) Scatter plot of the LF peak amplituderms from spectral analysis vs. fish-target angle (ϕpre) immediately preceding the swim. A trial consisted of the stimulus moving from center to periphery (rostro-caudal) or periphery to center (caudo-rostral), where it disappeared. Stimulus size and velocity 2° and 20°/s, respectively. Blue solid line: straight line fit. Also shown are data pairs (LF peak amplituderms; ϕpre) and straight line fit from first swims in freely moving larvae (gray symbols; same data as in Figure 3E).

