Figure 5.
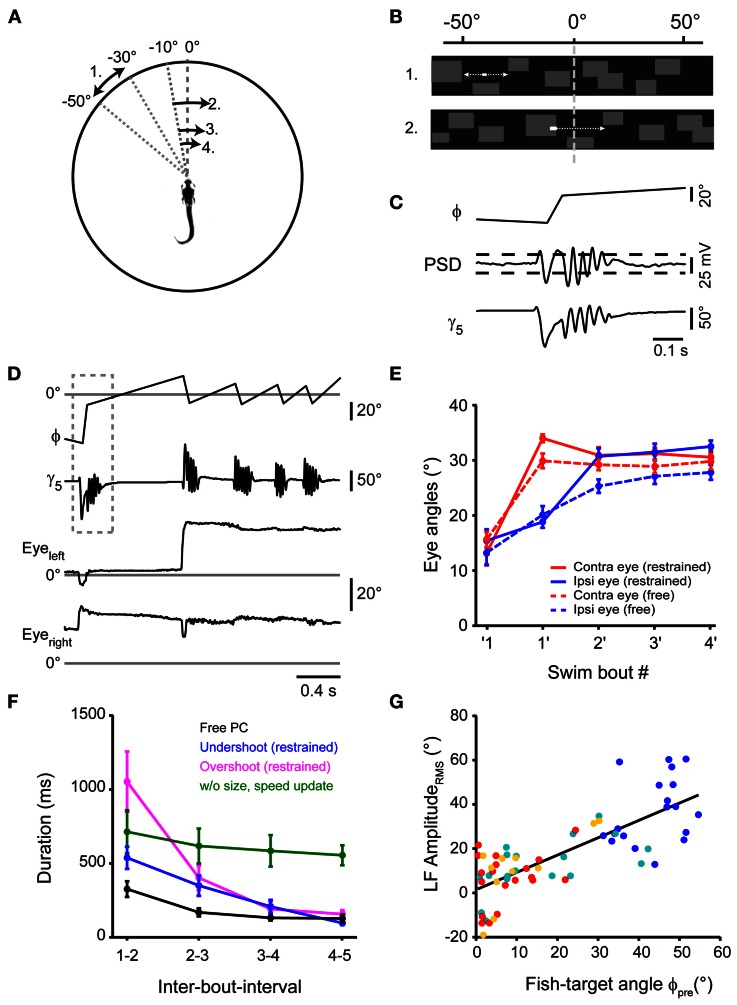
Virtual prey capture behavior in a closed-loop system. (A) Illustration depicting the stimulus update paradigm used to evoke prey capture-like swim sequences in minimally restrained larvae. Numbers indicate order of appearance of moving stimulus, arrows indicate direction. Here, following detection of a swim, the stimulus was translated to −10°, from where it moved across the midline into the contralateral visual hemifield. Target size and velocity were increased following each swim, emulating an approach of the larva toward the target. This is illustrated by reducing the distance of arrows in the diagram. (B) Representation of the stimulus from the perspective of the larva. Initially, a rectangular target moves in the periphery against a background of low spatial frequency content (upper panel). At the onset of a swim bout, target and background translate smoothly toward the visual field center (within ±10°, update velocity ~400°/s), emulating a change in orientation of the fish toward the target. Subsequently, the target continues to move against the background (lower panel). (C) Detection of swim bouts. Bottom: time course of caudal tail angle γ5, during a target-directed swim bout. Center: time course of PSD voltage during the swim. Top: fish-target angle (ϕ) before, during, and after the swim bout. Target and background rotation were triggered in real-time by threshold-crossing of the PSD signal (indicated by dashed horizontal lines). (D) A swim sequence resembling prey capture sequences in freely moving larvae, recorded in a minimally restrained larva. Top: time course of fish-target angle ϕ. Second from top: caudal tail angle γ5. Dashed box indicates temporal window shown in (C) on an expanded scale. Bottom two traces: left and right eye angle traces. (E) Comparison of ipsilateral eye angles (15.4 ± 2.1° before first swim; 32.5 ± 1.1° after 4th swim) and contralateral eye angles (13.1 ± 2.2° before first swim; 30.6 ± 1.3° after 4th swim) during sequences in restrained larvae (solid line; n = 19 sequences) to eye angles in freely moving larvae (broken line; n = 30 sequences). (F) Comparison of inter-bout-intervals (IBIs) for different stimulus conditions. Black line: IBIs during prey capture sequences in freely moving larvae (n = 30 sequences). Blue line: IBIs during sequences of restrained larvae, where target is translated to −10° during the first swim, representing undershoot (n = 11 sequences). Magenta line: IBIs during sequences of restrained larvae, where target is translated to +10° during the first swim, representing overshoot (n = 8 sequences). Green line: IBIs during sequences of restrained larvae, where target is translated to −10° during the first swim, representing undershoot, but without increases in stimulus size and velocity throughout the sequence (n = 6 sequences). (G) Scatter plot of the LF peak amplitude from spectral analysis vs. fish-target angle (ϕpre) immediately preceding the swim (n = 19 sequences). Same color code as in Figure 2.

