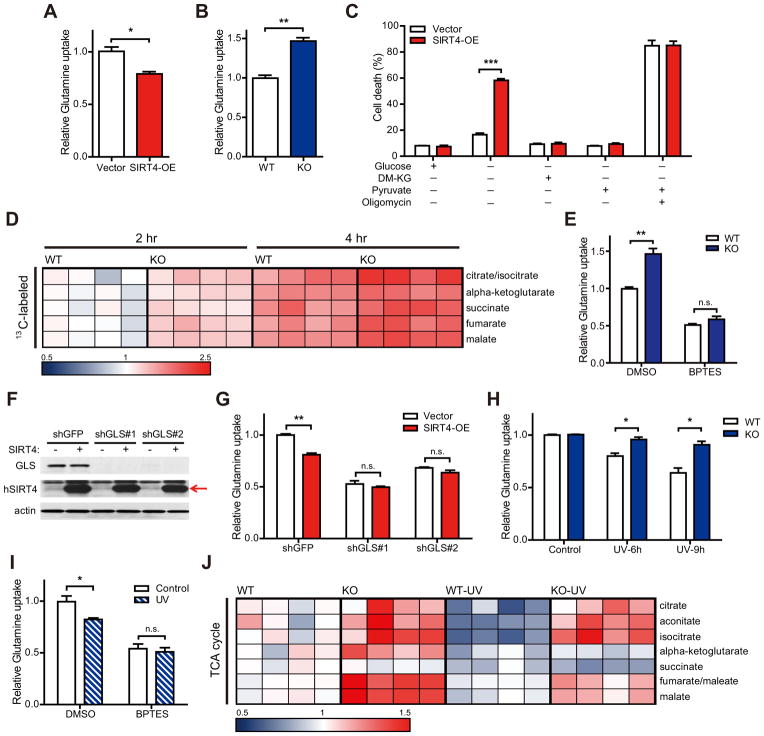
Figure 3. SIRT4 represses mitochondrial glutamine metabolism in response to DNA damage.
(A and B) Glutamine uptake in HepG2 cells stably expressing empty vector (Vector) or SIRT4 (SIRT4-OE) (A) or in immortalized WT and SIRT4 KO MEFs (B) (n = 3).
(C) HEK293T Vector or SIRT4-OE cells deprived of glucose were given DM-KG (7 mM), pyruvate (1 mM), and/or oligomycin (5 μg/ml). Cell viability was measured via propidium iodide (PI) exclusion assay (n = 3).
(D) Relative abundance of 13C-labeled TCA cycle intermediates (M+5 for α-ketoglutarate or M+4 for others) to the unlabeled from transformed WT and SIRT4 KO MEFs at the indicated times after pulse of 13C-glutamine (n = 4 samples of each condition).
(E) Glutamine uptake in immortalized WT and SIRT4 KO MEFs treated with dimethyl sulfoxide (DMSO) or BPTES (10 μM) (n = 3–4).
(F) GLS1 protein levels in HEK293T cells expressing GLS1-specific (shGLS#1 and 2) or control (shGFP) shRNAs. β-ACTIN serves as a loading control.
(G) Glutamine uptake in control (shGFP) or GLS-knockdown (shGLS#1 and 2) cells after transfection with empty vector (Vector ) and SIRT4 (SIRT4-OE) (n = 3).
(H) Relative glutamine uptake to each control in transformed WT and SIRT4 KO MEFs measured at the indicated times after 20 J/m2 UV exposure (n = 3).
(I) Glutamine uptake in DMSO or BPTES (10 μM) treated immortalized MEFs after 20 J/m2 UV exposure (n = 3).
(J) Heat map comparing relative levels of TCA cycle intermediates in transformed WT and SIRT4 KO MEFs at 4 hr after 20 J/m2 UV exposure (n = 4).
Data are means ±SEM. n.s., not significant. *p < 0.05, **p < 0.005, ***p < 0.0001.
See also Figure S3.

