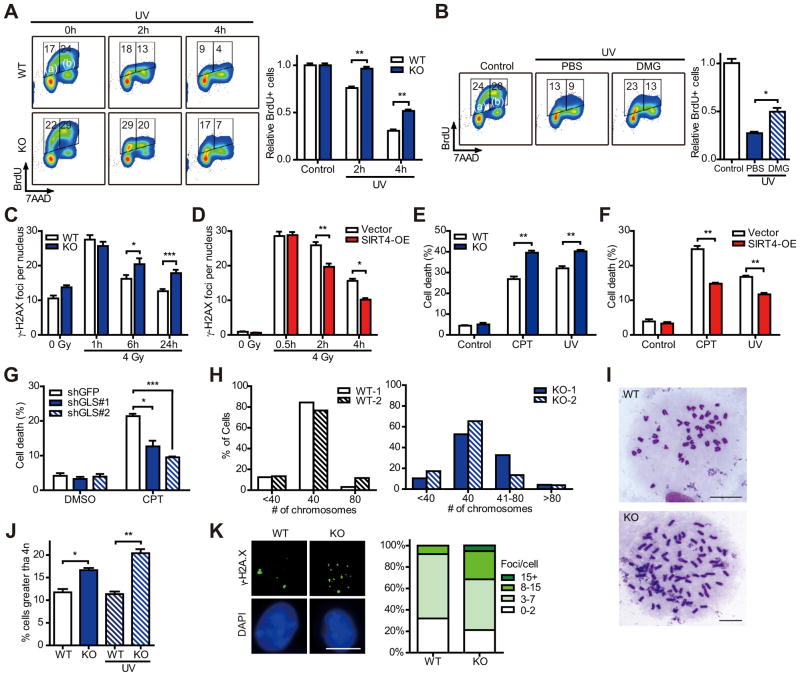
Figure 4. SIRT4 is involved in cellular DNA damage responses.
(A) The measurement of BrdU+ cells and total DNA content in transformed WT and SIRT4 KO MEFs at the indicated times after 20 J/m2 UV exposure (n = 3).
(B) The BrdU+ cell and total DNA content in transformed WT MEFs incubated with PBS or DMG (10 mM) after UV exposure (n = 3).
(C and D) The number of γ-H2AX foci in immortalized WT and SIRT4 KO MEFs (C), or Vector and SIRT4-OE HeLa cells (D) was counted at the indicated times after IR treatment.
(E and F) Survival of immortalized WT and SIRT4 KO MEFs (E), or Vector and SIRT4-OE HepG2 cells (F) treated with or without CPT (14 μM) or UV (30 J/m2) (n = 3–4). Cell viability was measured via PI exclusion assay.
(G) Survival of HepG2 cells expressing control (shGFP) or GLS1-specific (shGLS#1 and 2) shRNAs were treated with DMSO or CPT (14 μM) for 24 hr (n = 3). Cell viability was measured via PI exclusion assay.
(H and I) The percentage of chromosome number (H) and representative images of chromosome spread (I) of WT and SIRT4 KO MEFs at passage 2. Numbers of spreads counted were 64, 61, 142 and 104 for WT-1, WT-2, KO-1 and KO-2, respectively. Scale bar represents 10 μm.
(J) Transformed WT and SIRT4 KO MEFs were treated with or without 20 J/m2 UV and the percentage of cells containing greater than 4n is analyzed by flow cytometry (n = 3).
(K) Immunofluorescent staining of transformed WT and SIRT4 KO MEFs using nuclear (DAPI) and DSBs (γ-H2AX) markers (left). Scale bar represents 10 μm. The percentage of nuclei with the indicated number of γH2AX foci (right). WT MEFs (n = 119); KO MEFs (n = 71).
Data are means ±SEM. *p < 0.05, **p < 0.005, ***p < 0.0001.
See also Figure S4.

