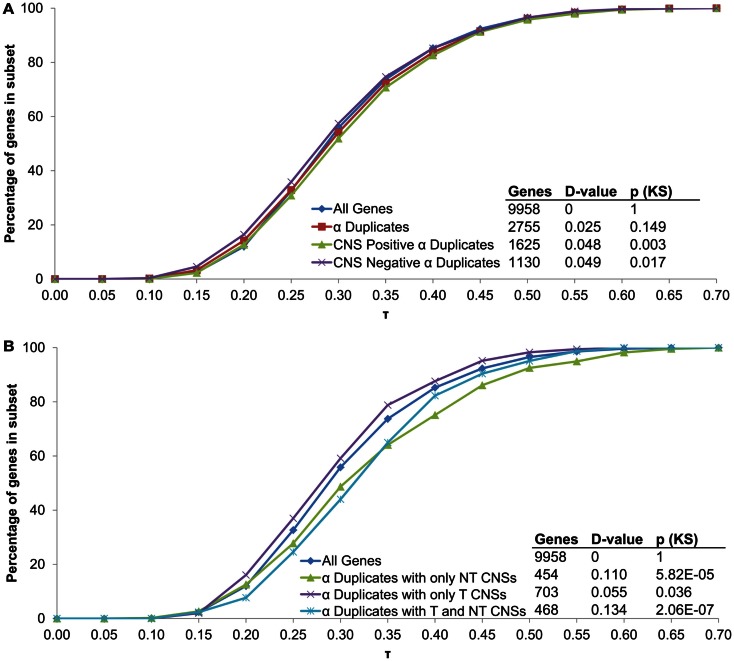
Figure 5.
The distribution of τ across α duplicates grouped by (A) CNS presence/absence and (B) subgene position restricted CNS annotation. Each gene subset is restricted to genes with annotated 5′ UTR, intron, and 3′ UTR sequence. The D-value represents the distance between the distributions and was used in the Kolmogorov–Smirnov (KS) statistic to determine statistical difference. CNS, conserved non-coding sequence; NT, non-transcribed; T, transcribed.

