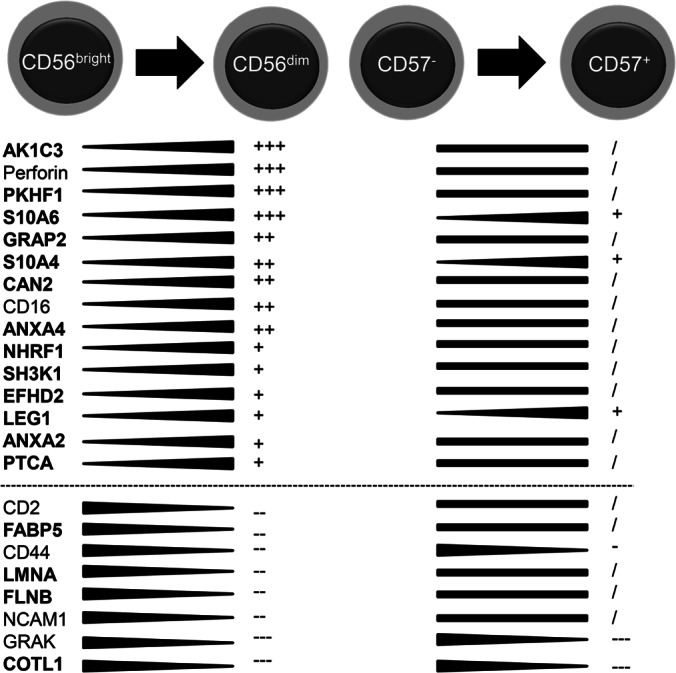
Fig. 5.

Changes in protein expression during distinct stages of NK cell differentiation. Selected proteins are shown together with their corresponding regulation intensity in CD56bright/dim and in CD57−/+ NK cells. Proteins with previously undescribed regulation in NK cells are shown in bold. Regulation intensity is depicted with the following symbols: +++ log2RF over 1.5; ++ log2RF over 1.0; + log2RF over 0.5;/unregulated (in between −0.5 and 0.5); - less than −0.5; - less than −1.0; — less than −1.5.
