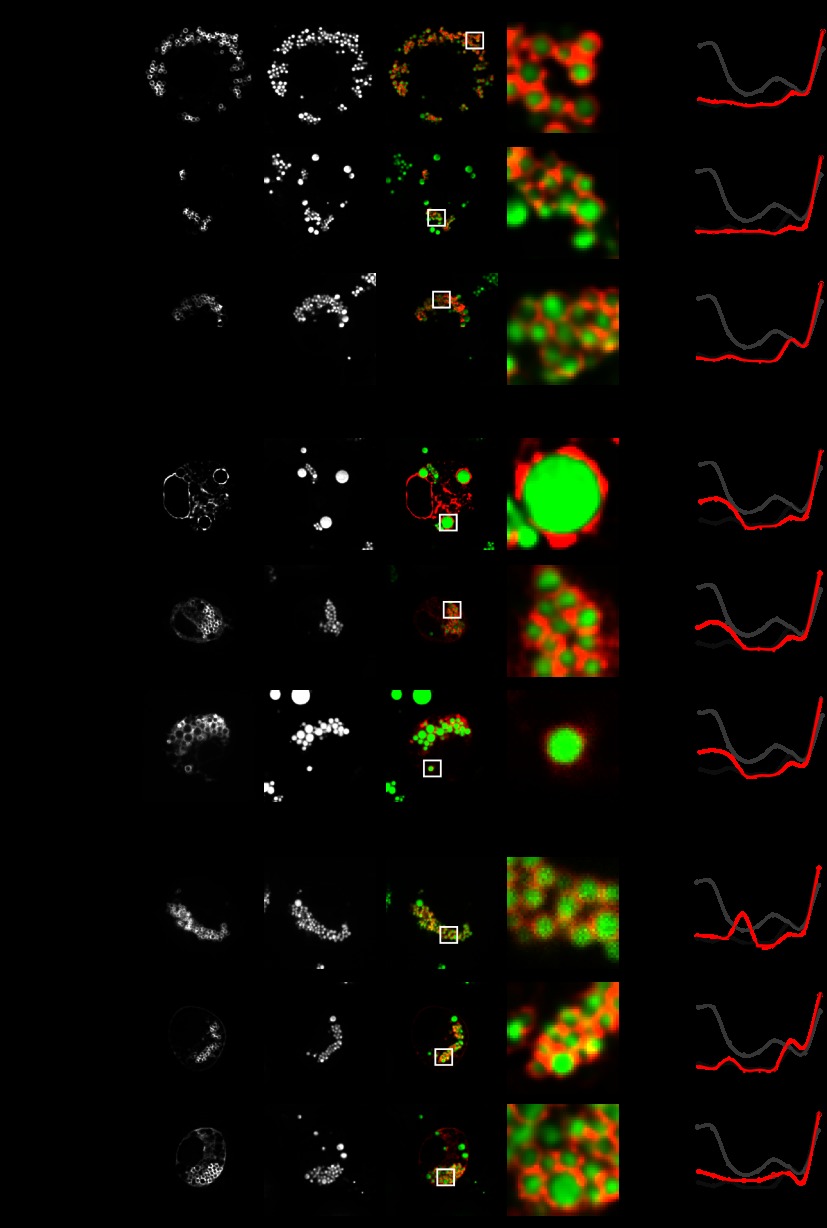
Fig. 4.
Localization of a subset of proteins found in the LD proteome as determined via fluorescent microscopy of expressed proteins. The indicated fluorescent mCherry-tagged enzymes were transiently expressed in S2 cells (left-hand panels, red) loaded with 1 mm oleate for 12 h. LDs were stained with BODIPY (middle panels, green). The overlays of the two channels and zoomed views of a representative LD section are shown (rightmost two panels). Bar = 5 μm (overview) or 1 μm. Protein correlation profiles for the tagged proteins are shown in the right-hand panels in red. Dark gray lines indicate averaged PCPs for LD proteins, and bright gray lines indicate averaged protein correlation profiles for ER proteins (Fig. 3A). A, proteins localizing exclusively to LDs. B, proteins localizing to LDs and ER. C, proteins localizing to LDs and any other cellular compartment.

