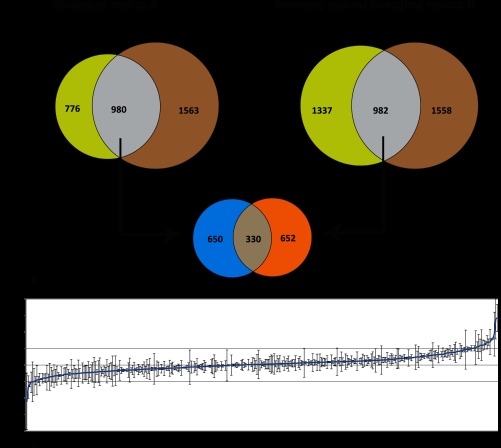
Fig. 2.
Filtering of phosphoproteomic data and performing normalization of phosphopeptides against their respective protein levels. a, Venn diagram indicates overlap in phosphopeptide and nonmodified protein populations for both biological replicas. The intersection corresponds to phosphopeptides whose protein of origin is also detected by peptides in a nonmodified form. Middle, Venn diagram shows overlap of phosphopeptides within these intersections between the two labeling experiments. b, phosphopeptides observed in both experiments normalized by nonmodified protein level. S-Curve depicts average ratio (across both experiments). Ratios of these 330 peptides are ranked from low to high. See Table I and supplemental Table 4 for list of phosphoproteins.

