
Fig. 3.
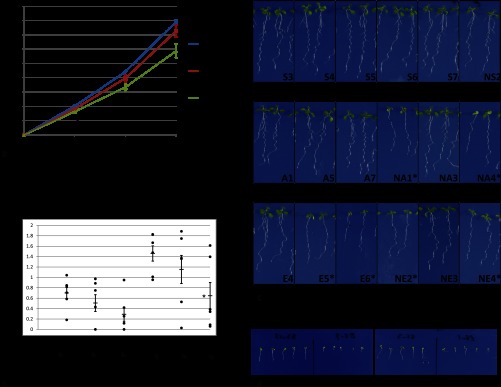
Inhibition of primary root growth and lateral root of SNX1 mutation. a, growth of primary roots at days 3, 6, and 9; averages of six independent lines continuously expressing SNX1-GFP, SNX1S16A-GFP, or SNX1S16D-GFP are shown; error bars depict S.E. Primary root of SNX1S16E-GFP shows significant differences from SNX1-GFP growth in all the time points tested, marked with asterisk (p < 0.05, Student's t test). b, average lateral root numbers are shown as a rectangle; numbers of individual lines are shown as black dots, and error bars depict S.E. SNX1S16E-GFP shows significant difference from SNX1-GFP at day 9 as marked with asterisk (p < 0.05). c, two representative seedlings from each line at day 9 are shown; lines with severe reduction of growth and low density of lateral roots are marked with asterisk. d, 3-day seedlings of two SNX1S16E-GFP lines showed growth arrest on ½GM without sucrose.