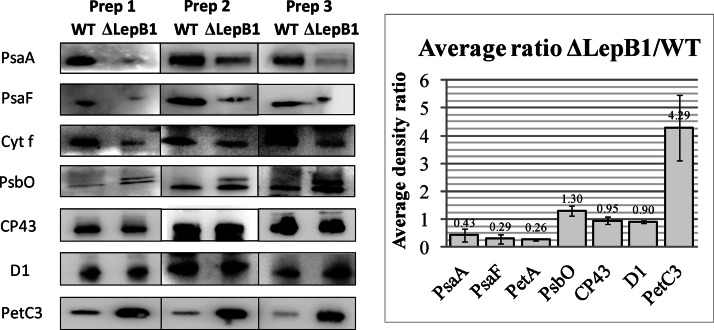
Fig. 3.
Western blot analyses comparing expression of proteins in WT and ΔLepB1. Samples containing 10 μg protein were loaded in each lane. Dilutions of primary antibodies (in TBS-T) were as follows: anti-PsaA and anti-PsaF 1:1000; anti-Cyt f, 1:500; anti-PsbO and anti-CP43, 1:3000; anti-D1, 1:5000; anti-PetC3, 1:2000. All individual blots were carried out three times using samples from independent cultures. Band intensities were quantified using MultiGauge and used to calculate the average ΔLepB1/WT ratios of the different proteins (histogram). Error bars refer to standard deviation in the averaging calculations.

