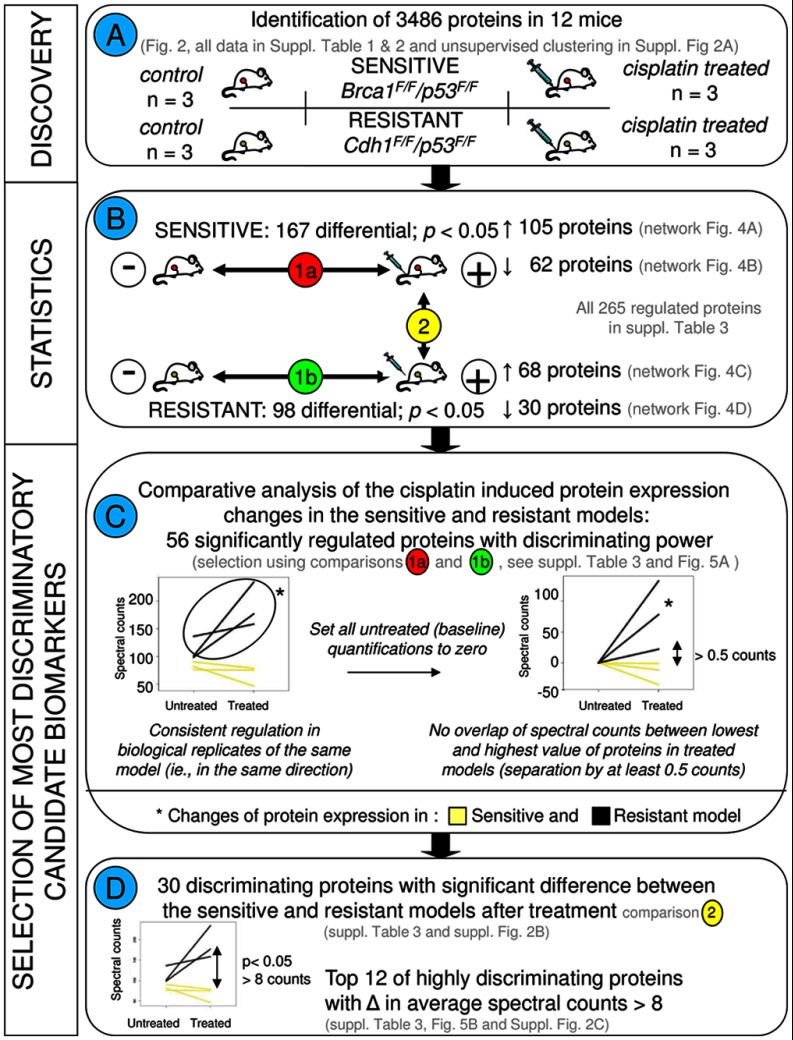
Fig. 3.
Flow chart depicting the different comparisons and criteria for selection of the most discriminatory biomarkers. A, describes the discovery experiment including four groups consisting of cisplatin-sensitive and -resistant models with the control and cisplatin treatment groups for each model, with three animals in each group. B, displays the statistical comparisons. All statistical analyses were performed using R as described previously (17, 18). To select the most discriminatory markers, we applied quantitative filtering in Excel. To this end, protein spectral count data of the 3486 proteins were exported from Scaffold to Excel. Paired statistical testing (18) in R identifies differentially expressed proteins between the treated and untreated tumors in each tumor type separately (comparisons 1a and 1b). C, shows the criteria to select for proteins with divergent regulation in the sensitive and resistant model. To this end, base-line transformation was applied to each protein. Furthermore, only proteins were retained that displayed a minimum separation of 0.5 counts between the lowest and the highest value in the two models after cisplatin treatment. This led to a selection of 56 discriminatory candidate markers. Left graph, example of untransformed spectral counts for the sensitive and resistant paired sets. Right graph, example using the same protein, with untreated tumors brought to a base line of zero counts. D, further selection was made to pinpoint the most discriminatory proteins. Using β-binomial statistics (17) on the list of 56 proteins, we selected 30 proteins who were significantly different between the sensitive and resistant models after cisplatin treatment (comparison 2 in B). From these 30 proteins, the top 12 was selected with highly divergent regulation patterns in the two models, i.e. proteins displaying on average at least eight counts of separation between the average values in both models after treatment (before base-line transformation).

