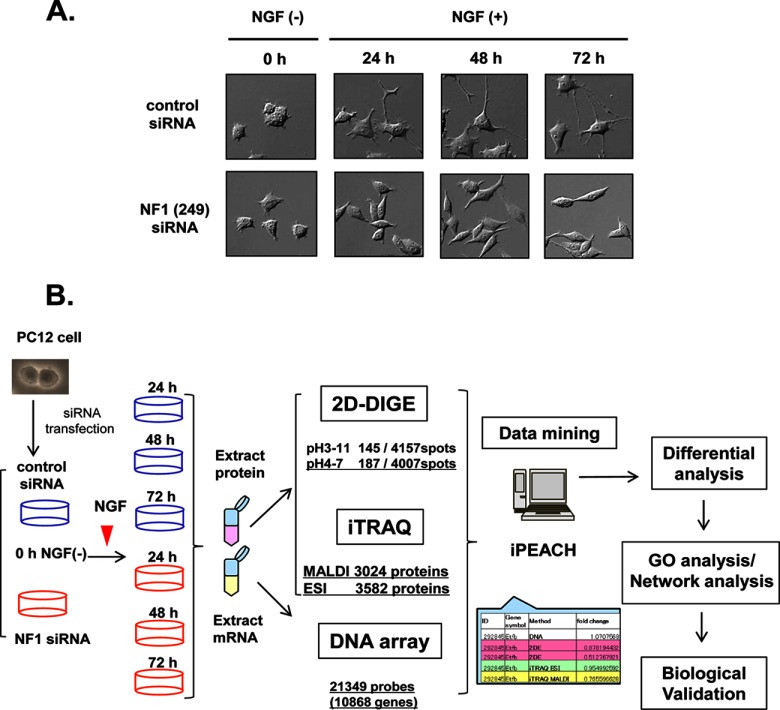
Fig. 1.
Workflow of the integrated proteomics approach to identify the abnormal network in NF1-KD PC12 cells. A, Representative images of NGF-stimulated PC12 cells treated with NF1 siRNA. PC12 cells were transfected with NF1 siRNA (lower panel) or control siRNA (upper panel), treated with NGF, and observed at the indicated time points. B, Workflow of the integrated proteomics approach. PC12 cells were transfected with control siRNA or NF1 (249) siRNA and stimulated with NGF, and protein and mRNA samples were prepared from the cells at the indicated time points (0 h, NGF-; 24 h, 48 h, and 72 h; NGF+). The protein and mRNA samples were subjected to 2D-DIGE and iTRAQ-eight-plex methods and DNA microarray Rat 230 2.0 gene chip analysis (Affymetrix), respectively. After these analyses, an integrated chart from all data was generated using iPEACH to identify differentially expressed genes and proteins. Further biological and functional interpretation of the differentially expressed genes and proteins was carried out by GO and network analyses followed by cell biological analyses.

