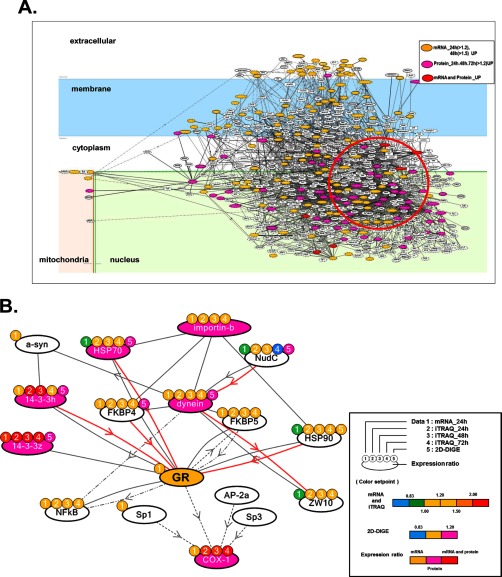
Fig. 3.
Molecular network analysis of up-regulated genes and proteins in NF1-KD PC12 cells. A, The list of genes/proteins up-regulated by the NF1 siRNA treatment in PC12 cells (supplemental Table S7) was imported into KeyMolnet. Using the “start points and end points” network search algorithm, KeyMolnet illustrated a highly complex network of targets with the most statistically significant relationships. Orange nodes represent up-regulated genes, pink nodes represent up-regulated proteins, and red nodes represent up-regulated genes and proteins. White nodes indicate additional nodes extracted automatically from the core contents of KeyMolnet to establish molecular connections. B, Extraction of the abnormal molecular network including dynein IC2, GR, and COX-1 from the molecular network shown in A. Color marks represent numerical data for each method as follows: color mark 1: 24 h mRNA, 2: 24 h iTRAQ, 3: 48 h iTRAQ, 4: 72 h iTRAQ, 5: 2D-DIGE. Color set point is described in right panel of (B). The cluster of up-regulated proteins including dynein IC2, GR, and COX-1 is highlighted by a red circle. The molecular relationships are indicated by a solid line with arrow (direct binding or activation), solid line with arrow and stop (direct inactivation), solid line without arrow (complex formation), dashed line with arrow (transcriptional activation), and dashed line with arrow and stop (transcriptional repression).

