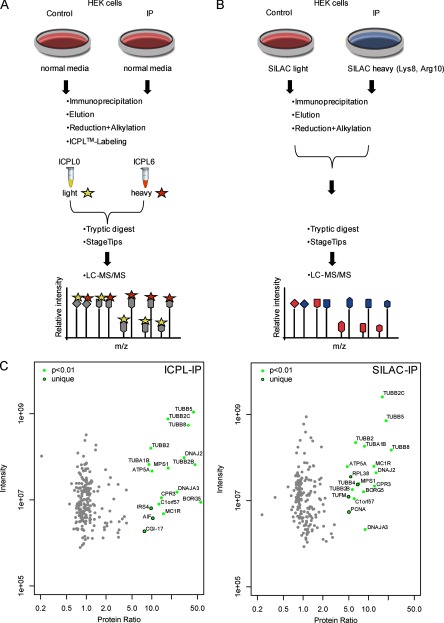
Fig. 2.
Comparison of ICPL and SILAC for quantitative immunoprecipitation. A, Experimental scheme of the quantitative β-tubulin ICPL-IP using cultured HEK293T cells. Equal amounts of cell lysate are taken either for the control or for the IP. After IP, samples are ICPL-labeled and analyzed by LC-MS/MS. Specific interaction partners are determined by significant enrichment in the IP, whereas nonspecific binders are identified by ratios of 1:1. B, Experimental scheme of the quantitative β-tubulin IP with SILAC-labeled HEK293T cells. The workflow is equivalent to the ICPL-IP procedure except that proteins in the cells are already metabolically SILAC-labeled. C, Detection of specific protein complex components and nonspecific background of the β-tubulin ICPL-IP and SILAC-IP in HEK293T cells. Plotted are log10 ratios (x axis) and log10 intensities (y axis) for each protein quantified. Significantly enriched proteins (p < 0.01) found in common are plotted in green. Uniquely detected β-tubulin complex components (p < 0.01) for each approach are shown with black circles, nonspecific binders in gray (for details see Experimental Procedures and Table II).

