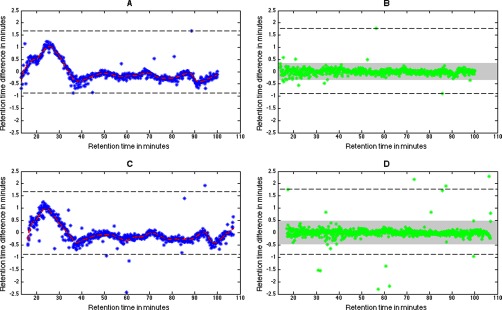
Fig. 6.

The estimated spline function between two technical replicates from the Clone data set is shown as a red dashed line where the blue markers correspond to time differences before alignment for the feature set used for interpolation. The retention time window for the identity-aided regression function is marked with a black dashed line. The right hand side figures show the time differences after applying the function to the feature set used for parameter estimation and the set time tolerance is seen in gray. The larger retention time differences seen for the tolerance-based approach (C, D), led to a larger estimated time tolerance compared with the identity-aided one (A, B). A shift in the total retention time span can also be seen in the x axis of the plots.
