
Fig. 9.
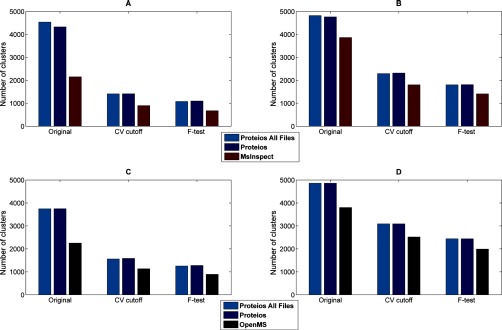
The number of feature clusters in every step of the quantification evaluation; number of clusters used for evaluation (original), number of clusters passing the CV cutoff (CV cutoff), and the number of clusters where the linear response could not be rejected at a significance level of 0. 05 (F-test). A, and (C) correspond to the TimePoint data set and (B) and (D) to the Clone data set. Features from msInspect were used in (A) and (B), whereas OpenMS features were used in (C) and (D). Proteios shows a higher number of clusters for both software comparisons, which is a result of substantially higher recall for the alignment. Overall, similar ratios of clusters are considered correctly quantified, which is an indication of the relatively lower difference in precision between the software solutions. The high agreement between Proteios runs using only the evaluated data set or the complete set of files shows the reproducibility of the analysis, irrespective of how many files are aligned at once.