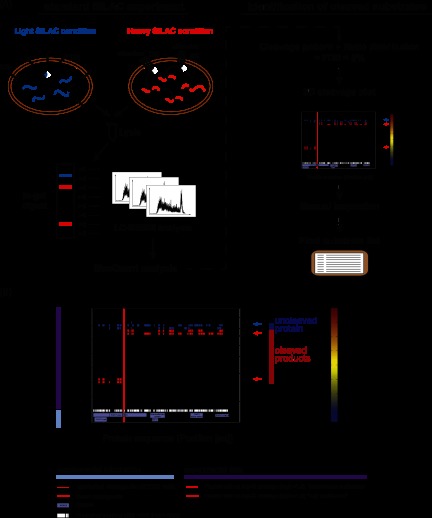
Fig. 1.
Representation of the SILAC-based approach for the detection of proteolytic substrates. A, schematic overview of the SILAC experiment followed by stringent statistical data filtering to extract caspase-dependent cleavage substrates. In a SILAC double-labeling experiment, the cells are treated with an apoptotic stimulus (heavy condition) or mock (light condition). Cells are combined and lysed, and proteins are separated via SDS-PAGE. After in-gel digestion, each slice is analyzed via LC-MS/MS. Cleavage candidates are identified on the basis of specific cleavage criteria and via the application of statistics to the data. Graphs are generated for each candidate and manually inspected before the generation of a final substrate list. DR, death receptor. B, Three-dimensional cleavage plot representation. The plot combines both experimental data and background information. Detected peptides are depicted as squares defined by slice and sequence localization, including the color-coded corresponding ratio. Detected cleavages C-terminal of Asp are highlighted within the plot by red lines. Supplemental information includes theoretical cleavage of the protein (peptides are plotted as squares), known and hypothetical cleavage sites along the protein sequence, and known protein domains and motifs. Blue and red arrows indicate the location of the uncleaved and cleaved regions, respectively. Information provided within the graph is explained below the three-dimensional cleavage plot. Experimental data are depicted in the main upper part of the plot, and specific information at the bottom of the plot.

