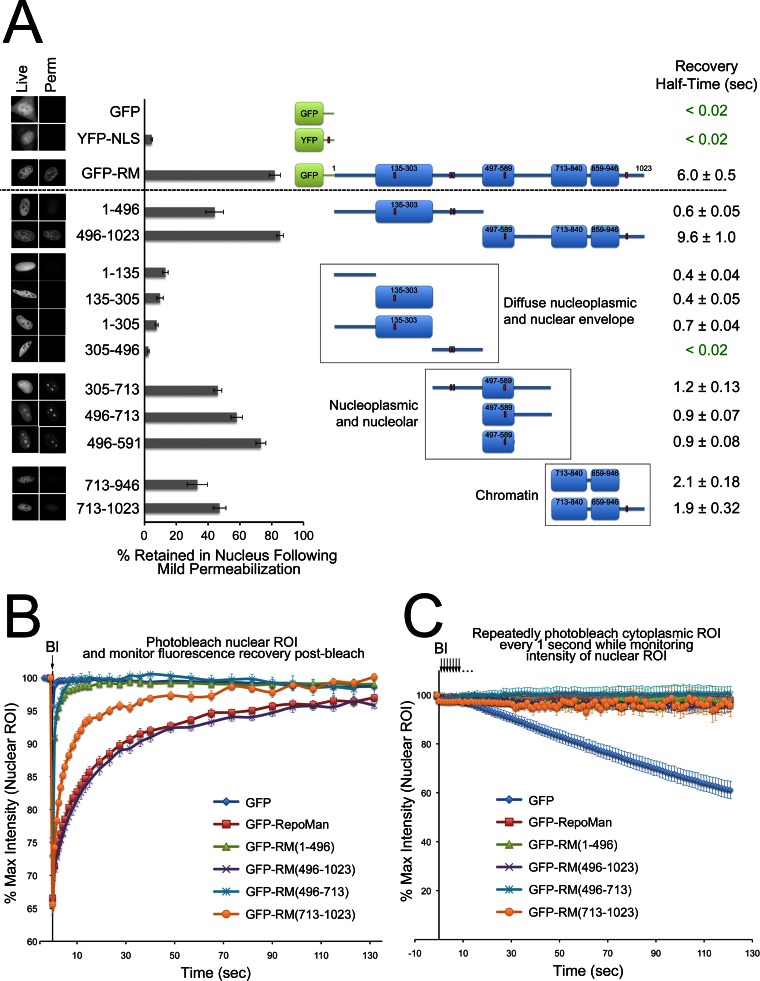
Fig. 2.
Design of truncation mutants for the analysis of domain-specific RepoMan interactomes. A, Localization of GFP-RepoMan (GFP-RM) in live HeLa cells before (“Live” panel) and after (“Perm” panel) mild permeabilization with 0.1% Triton X-100. Localization of free GFP and YFP-NLS (nuclear localization signal added to enhance nuclear and nucleolar accumulation) in the cell is shown for comparison. Scale bars are 5 μm. The diagram in the center shows predicted globular (box) and disordered (line) regions in RepoMan and highlights the PP1-binding RVxF motif (blue box) and predicted NLSs (red boxes). Localization in live cells before and after mild permeabilization is shown for each fragment and summarized on the graph as % retained in nucleus. Data are mean ± S.E. (n = 13–40, 3–4 separate experiments). B, FRAP (Fluorescence Recovery After Photobleaching) experiment comparing the recovery rates of the photobleached N-terminal (1–496, green triangles) and C-terminal (496–1023, purple crosses) halves of RepoMan within a nucleoplasmic region of interest (ROI) to that of the full-length protein (red squares) and free GFP (blue diamonds). Also shown are the recovery curves for the split C-terminal halves: 496–713 (turquoise crosses) and 713–1023 (orange circles). A pre-bleach image was acquired, a nucleoplasmic ROI photobleached at the 0 time point (arrow) and the GFP signal within that ROI monitored over time. Data are mean ± S.E. (n = 7–31, three separate experiments). Recovery half-times for nucleoplasmic pools of all fragments tested are summarized in the far right column in (A) as mean ± S.E. C, FLIP (Fluorescence Loss In Photobleaching) experiment assessing nucleocytoplasmic shuttling. A cytoplasmic region of interest was continually photobleached every 1 s (arrows) for a total of 126 s, with images taken after each bleach event. Total intensity over time for a nuclear ROI was normalized for photobleaching because of image acquisition. Data are mean ± S.E. (n = 4–7, 3 separate experiments). GFP, which shuttles freely between the nucleus and cytoplasm (nuclear pool is continually depleted as the protein trafficks through the cytoplasmic region of interest and is irreversibly photobleached) was used as a positive control.

